A $100,000 salary can buy a comfortable life.
Apparently, it can’t always buy a house.
Under Houzeo’s 2026 affordability model, a $100K household can comfortably afford its state’s median-priced home in just 11 states. In the other 39 states and Washington, D.C., the income requirement exceeds six figures.
The same model also says a $100K household can comfortably buy a home priced at or below $297,000. To afford the national median home of $429,100, a household needs approximately $144,500 annually.
That’s a $44,500 gap you need to cover if you earn $100K. And that’s something you have to solve before you confront the down payment, mortgage approval, or competition from cash home buyers.
The problem isn’t simply what Americans earn. It’s what their income can actually buy, where they can afford to live, and how much wealth they need before they can even make an offer.
The salary hasn’t changed. The cost of entering the housing market has.
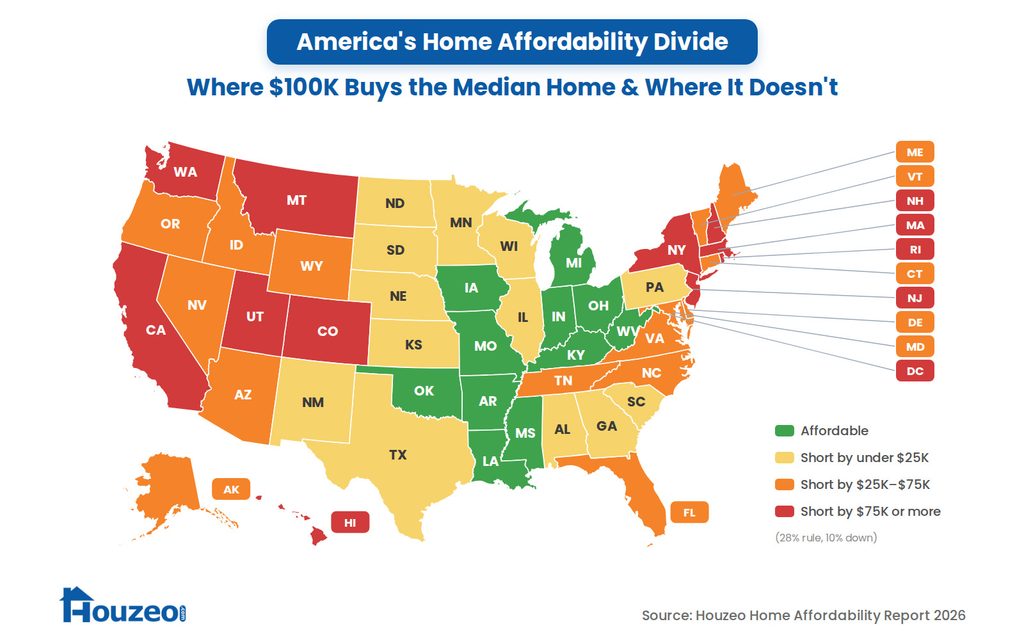
The map shows how uneven homeownership affordability has become, even for households earning above the national median income.
But a state passing the $100K test doesn’t mean every home in that state is affordable. These comparisons use statewide median sale prices and standardized mortgage, tax, and insurance assumptions.
Because those costs are standardized, each state’s result tracks its median price. Any state where the median home costs more than $297,000 requires more than $100K.
Differences within states can be as consequential as those between them.
States Where $100K Is Enough to Buy the Median Home
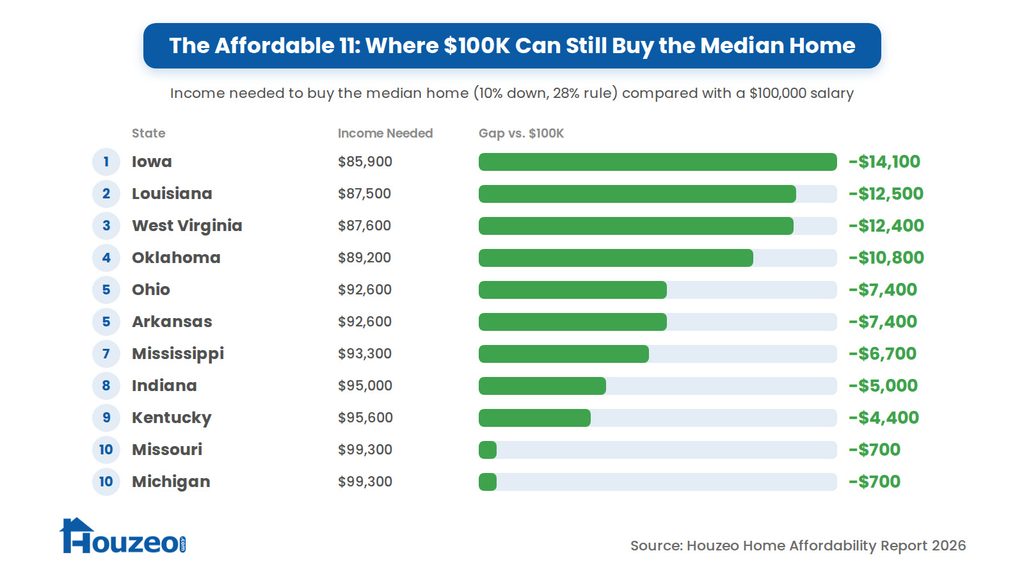
Only 11 of America’s 50 states pass the $100,000 affordability test. In those markets, a six-figure household can comfortably afford the median-priced home under Houzeo’s affordability model.
- Iowa has the lowest modeled income requirement at $85,900, followed by Louisiana at $87,500 and West Virginia at $87,600.
- Other qualifying states include Oklahoma, Arkansas, Ohio, Mississippi, Indiana, Kentucky, Michigan, and Missouri.
The distinction between Iowa and Missouri is notable.
In Iowa, the modeled income requirement is 14.1% below $100,000. In Missouri, the margin is just 0.7%. Both states pass the affordability test, but with very different cushions.
That doesn’t mean households will have money left over. Property taxes, insurance, everyday expenses, existing debt, and home maintenance can quickly eat into a budget.
But these states still stand out for one reason: a household earning $100,000 a year has a realistic shot at affording a median-priced home, something that’s becoming harder to find across the country.
States Where a $100K Salary Still Leaves Buyers Priced Out (The Worst 10)
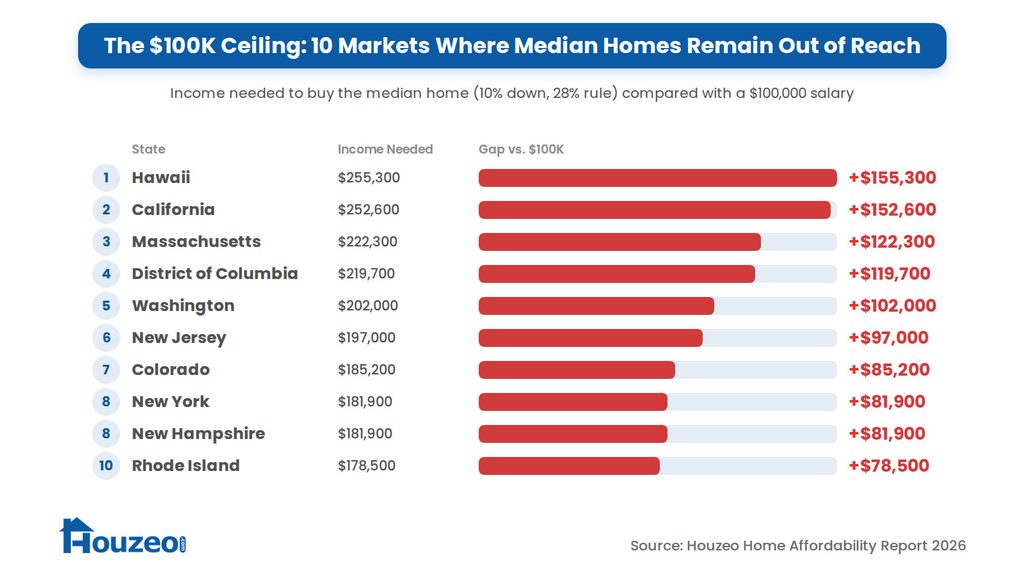
If the 11 affordable states offer some reassurance, the other end of the rankings delivers a reality check. In several states, earning $100,000 doesn’t even get a household halfway to the income needed to buy the median-priced home.
The affordability gap is heavily concentrated in the West and Northeast. Together, they account for nine of the 10 largest shortfalls. Washington, D.C. is the tenth.
Here’s how the highest income requirements break down by region:
- West (4 states): Hawaii ($255,300) and California ($252,600) lead the nation, followed by Washington ($202,000) and Colorado ($185,200).
- Northeast (5 states): Massachusetts requires $222,300, followed by New Jersey ($197,000), New York and New Hampshire (tied at $181,900), and Rhode Island ($178,500).
- Washington, D.C. ($219,700): Requires nearly $120,000 more than a six-figure household earns. This places it among the five highest income requirements nationally.
- South and Midwest: No state from either region makes the top 10. D.C. is technically part of the Census South and is listed separately here.
What Does this Mean?
Earning $100,000 a year might sound like a comfortable income, but in states like Hawaii and California, it isn’t nearly enough to afford a median-priced home under this model.
In Hawaii, a household would need to earn another $155,300 a year to meet the estimated affordability threshold. California isn’t far behind, with an income gap of $152,600.
And it’s not just the most expensive states. Even in Rhode Island, which ranks tenth for the largest income shortfall, households would need to earn nearly 79% more than $100,000 to comfortably afford a median-priced home.
These aren’t differences that a modest raise or a slightly smaller down payment can necessarily resolve. Statewide figures don’t capture the full variation between individual cities. The underlying problem extends well beyond the country’s most expensive coastal neighborhoods.
Redfin’s August 2026 affordability analysis, based on June data, shows how wide metro-level differences can be. Buyers in Pittsburgh needed about $82,816 to afford the median-priced local home, while buyers in San Francisco needed $453,205, the highest of any metro Redfin tracked.
The findings aren’t directly interchangeable, but they reinforce the same brutal reality: an income that comfortably supports homeownership in one market may fall far short in another.
For a $100K household, geography can mean the difference between affording the median-priced home and needing more than twice its annual income to buy one.
A Cheaper Home Doesn’t Always Mean an Affordable Home
A home priced below the national or the state’s median price isn’t automatically within reach of a $100K household.
Consider Texas. Its median home sale price was approximately $334,000 in August 2026, nearly $95,000 below the national median home price of $429,100. Yet under Houzeo’s model, a household needs an estimated $112,500 annually to comfortably afford the state’s median-priced home.
That’s $12,500 more than a six-figure household earns. And Texas isn’t alone.
States such as Georgia, North Carolina, and Florida have median home prices below the national benchmark, yet the model still requires household incomes above $100,000.
Property taxes, insurance, and other ownership expenses can further change the calculation, specifically in areas where actual local costs differ from the model’s standardized assumptions.
The $100K Problem: Buying the Median Home Takes $144,500
Under Houzeo’s 2026 Home Affordability Report model, buying the national median-priced home with 10% down requires an estimated annual household income of $144,500. That’s $44,500, or 44.5%, more than a $100,000 gross salary.
We calculated this value assuming that a household will not spend more than 28% of its gross income on housing, a 7.28% mortgage rate, and estimates of property taxes, homeowners insurance, and private mortgage insurance. So if you have a $100K salary, you can comfortably spend about $2,333 a month on housing.
If we increase the housing-cost threshold to 36%, it raises the estimated purchase budget to $382,000. That’s still well below the national median home price of $429,100.
That doesn’t mean lenders would reject every borrower earning $100K. Loan programs allow different debt-to-income ratios, and buyers with substantial savings may qualify for larger loans.
It means the median-priced home falls outside Houzeo’s defined comfortable budget.
Why Affordability Estimates Vary So Widely
Not every affordability study arrives at the same income requirement.
Redfin’s August 2026 analysis estimated that a household needed $109,796 annually to afford a typical U.S. home. That’s nearly $35K less than Houzeo’s $144,500 estimate. The $34,704 difference comes largely from how affordability is measured.
Redfin assumes buyers put 15% down and spend up to 30% of their income on housing. In our model, we took a more conservative approach: a 10% down payment, a 28% income limit for housing costs, private mortgage insurance, and a 7.28% mortgage rate. The studies also use different home-price benchmarks and ownership-cost assumptions.
Redfin also found that, under its methodology, just 34.2% of U.S. listings were affordable to the typical household. Neither income estimate represents a universal minimum for homeownership.
A household’s buying power depends not just on its salary but also on its down payment, mortgage rate, and recurring ownership costs.
And these differences aren’t purely academic. Changes in financing assumptions can shift a household’s affordable purchase budget by tens of thousands of dollars.
A $100K Household Can Afford the Payment and Still Struggle to Buy
Being able to afford the monthly mortgage payment is one thing. Having enough money saved to actually buy the home is another.
According to Houzeo’s estimates, a household earning $100,000 a year and saving 10% of its income would need about 5.6 years to cover a 10% down payment and 3% in closing costs on a $429,100 home, the national median. Saving for a 20% down payment would take nearly a decade.
This is where first-time buyers face a bigger challenge. The National Association of Realtors’ 2025 Profile found that first-time buyers put down a median of 10%, compared with 23% for repeat buyers. That’s a 13-percentage-point gap.
First-time buyers often have to build their savings from scratch. Repeat buyers, meanwhile, may have years of home equity to put toward their next purchase.
So, two households earning the same $100,000 could be looking at the exact same home but have completely different chances of buying it.
Their salaries match.
Their savings and home equity often don’t.
The $100K Line Where Cash Gives Way to Mortgages
Moving down the price ladder doesn’t necessarily make competition easier.
Houzeo’s 2026 offer data shows an interesting divide: 74% of valid offers on homes below $100,000 were all-cash, while 74% of offers between $100,000 and $200,000 were mortgage-financed.
Cash buyers also offered a lower median share of the listing price (85.5%) than mortgage-financed buyers (89.7%) across Houzeo’s cleaned sample.
That doesn’t establish that cash buyers negotiated better prices on comparable homes. Different properties, buyer motivations, and price ranges could explain part of the difference. Nor does the cash-offer share prove those bids were accepted more frequently.
The wider industry data offers context. NAR’s 2025 buyer profile found that 26% of purchases were all-cash, including 30% of repeat-buyer purchases. Unlike Houzeo’s offer data, these figures represent completed transactions. Nevertheless, both datasets underscore an important distinction.
Cash buyers can avoid mortgage approval and financing contingencies, reducing some of the uncertainty sellers face. That can make offers from cash buyers more appealing to home sellers, even when they come in lower.
Having enough income to qualify for a mortgage isn’t the same as having enough financial leeway to compete with buyers who don’t need one.
Affordability Doesn’t End at the Listing Price
Not every segment of the housing market is equally out of reach.
Redfin’s 2026 research found that the typical household earned approximately $17,000 more than the income needed to buy a median-priced starter home in June. Yet, as noted above, only about a third of all listings were affordable.
Starter homes represent a lower-priced portion of the market. Their availability doesn’t establish that buyers can find suitable properties in their preferred location, condition, or configuration.
Houzeo’s buyer research offers a useful perspective on what shoppers want beyond price. We found that:
- 86% of location-known inquiries involved places outside the 50 largest U.S. cities.
- 70% of bedroom-specified searches targeted two- or three-bedroom homes.
- 36% of feature-filtered searches included outdoor space.
- About 1 in 10 custom-inquiry users asked about recurring ownership costs, including taxes, insurance, HOA fees, utilities, or land rent.
The findings describe different samples and interactions, not a single representative group of American buyers.
They also don’t prove that people are leaving major cities because of affordability. What they show is that buyers continue to express particular preferences during searching for homes. Price is only one part of that search.
For a $100K household, even a home within its modeled $297,000 budget may involve compromises on location, space, or condition. A lower purchase price doesn’t automatically make a home the better financial choice, either.
A $280,000 condominium with substantial HOA fees and special assessments can place a heavier burden on the monthly budget than its listing price suggests.
A home isn’t truly affordable just because its listing price fits the budget. Its monthly costs and fit matter, too.
So, Is $100K Still a Good Homebuying Salary?
Yes.
But where a household wants to buy, and how much wealth it already has, can change the answer dramatically.
In 11 states, $100K is sufficient to afford the median-priced home under Houzeo’s model. Elsewhere, households may need to buy below the median, increase their down payment, consider a different location, or accept higher monthly housing expenses.
A lower mortgage rate could improve purchasing power. Under Houzeo’s assumptions, reducing the rate from 7.28% to 6.28% raises the budget of a $100K household from approximately $297,000 to $321,000.
And rates aren’t guaranteed to fall. Freddie Mac’s 30-year average has since climbed to 7.40%, where it held on both October 8 and October 15, after Houzeo’s modeling cutoff.
The affordability struggle also shows up in who’s buying homes. According to NAR’s 2025 Profile, first-time buyers accounted for just 21% of purchases, the lowest share since tracking began in 1981. Their median age reached a record 40 years.
Six figures haven’t lost their value. But in today’s housing market, income alone no longer guarantees access to the typical home.
A $100K salary may get a household to the starting line. Existing equity and savings can determine who actually gets the keys.
Methodology and Limitations
This article draws on Houzeo’s 2026 Home Affordability Report, proprietary buyer research, and publicly available housing-industry data.
In Houzeo’s affordability model, we assume a 30-year mortgage at 7.28% (Freddie Mac, October 1, 2026), a 10% down payment, no other monthly debt, and housing expenses limited to 28% of gross monthly income. Modeled payments include principal, interest, property taxes, homeowners insurance, and private mortgage insurance.
For state median sale prices, we used August 2026 figures from Redfin. Individual markets may differ substantially in property taxes, insurance costs, HOA fees, and financing conditions. Because taxes, insurance, and PMI are standardized, state income requirements scale directly with each state’s median price.
Houzeo buyer behavior figures describe anonymized platform activity in 2026 (January to September) from Houzeo’s 2026 Home Buyer Report and What Buyers Want in a Home: Q3 2026. The offer analysis comprises 419 valid offers from 261 unique buyers after exclusions, while the pre-approval, saved-search, and custom-inquiry statistics come from different samples. Those findings should not be interpreted as nationally representative estimates.
State affordability estimates and national home-price benchmarks also use different source datasets. All estimates are illustrative, not mortgage pre-approvals or individualized financial advice.
Sources
- Houzeo, “How Much House Can You Afford? (Home Affordability Report 2026),” October 2026
- National Association of Realtors, “Existing-Home Sales”, August 2026
- Redfin, “The Income Needed to Afford Typical American Home Holds Steady Near Record High of $110,000,” August 5, 2026
- Redfin, “First-Time Buyers Catch a Break as Starter-Home Affordability Improves,” August 2026
- Freddie Mac, “Primary Mortgage Market Survey,” October 1–15, 2026
- National Association of Realtors, “2025 Profile of Home Buyers and Sellers,” November 2025
- Houzeo, “2026 Home Buyer Report”
- Houzeo, “What Buyers Want in a Home: Q3 2026”
- Houzeo, “The American Home Buyer Profile,” September 2026
- Consumer Financial Protection Bureau, “Buying a House”
- U.S. Bureau of Economic Analysis, “Personal Income and Outlays, July 2026,” August 2026
- Redfin, “Redfin Data Center,” state median home sale prices, August 2026
Media and researchers can cite this analysis with attribution to “Houzeo” and a link to this page.
Disclosure
Houzeo is a real estate platform that offers flat fee MLS listings, cash offers for home sellers, and home search tools for buyers. Houzeo may benefit financially when buyers or sellers use these services. The analysis in this article was produced by Jai, the Digital Marketing Manager at Houzeo, and was not commissioned, funded, or reviewed by any third party.
Houzeo’s proprietary figures come from anonymized, aggregated platform activity.
Disclaimer
This article is for general informational purposes only. It is not financial, mortgage, legal, tax, or investment advice, and it is not a mortgage pre-approval or a guarantee of loan eligibility.
Affordability estimates are based on the model assumptions described in the methodology. A household’s actual buying power depends on its income, debts, credit, savings, down payment, loan program, interest rate, and local costs such as property taxes, insurance, and HOA fees. Readers should consult a licensed mortgage lender, financial advisor, or real estate professional before making any home purchase decision.
Market data, mortgage rates, and home prices change frequently. All figures represent the dates stated in this article and may no longer be current. Third-party data from the National Association of Realtors, Redfin, Freddie Mac, the U.S. Bureau of Economic Analysis, and the Consumer Financial Protection Bureau is cited as published. Houzeo does not guarantee its accuracy. References to these organizations do not imply their endorsement of Houzeo or this analysis.
Houzeo’s proprietary data reflects activity on its own platform and is not nationally representative.