Every year, Americans leave expensive metros, chase jobs, move closer to their family, or simply decide that paying $3,000 a month for a shoebox apartment has lost its charm.
Before the boxes are packed, buyers compare cities, check prices, save homes, contact agents, and sometimes shop hundreds of miles away from where they currently live.
What if we compare where Americans are moving with where Houzeo buyers are searching?
At Houzeo, we analyzed a sample set of 793 saved searches, 4,811 inquiries, and 501 offers across 47 states from January through September 2026, and compared that behavior with U.S. Census domestic migration data.
The signals overlap in some markets, but they are not interchangeable. Across states with data for both measures, the linear correlation is just 0.08, and the rank correlation is 0.38.
In other words, the people moving across America and the people shopping for homes online are telling two complementary stories.
Key Takeaways
- Florida ranks #8 in net domestic migration (+22,517) and #1 in Houzeo buyer searches with a 13.1% share (104 searches, 707 inquiries, and 55 offers). That’s more than double the second-ranked state (Texas, 8.2%)
- California recorded net domestic migration of -229,077, and ranks #50, the largest domestic outmigration of any state. Yet it ranked #6 in Houzeo search activity (34 saved searches, 236 inquiries, 39 offers)
- South Carolina (+66,622, #3) and Alabama (+23,358, #7) both gained more domestic residents than Florida, yet together account for 4.5% of Houzeo searches.
- Single-family homes were seen in 28.5% of all property-type selections; multi-type searches (single-family + townhouse + condo) were more common than single-type searches
The Migration Map Is Not the Home-Search Map
Traditional migration reports from the Census Bureau, U-Haul, and United Van Lines explain where residents are moving. Houzeo’s data adds another layer: where buyers are actively exploring homes.
The two metrics answer fundamentally different questions:
- Migration captures completed relocations, driven by jobs, taxes, family, and cost of living.
- Home search captures active exploration, which includes local residents, cross-state browsers, investors, and early-stage planners who may never move.
This distinction matters when migration data is used as one indicator of housing demand. Migration captures completed population movement, while search data may reveal interest much earlier in the buyer journey.
When we compare the two directly, the relationship is surprisingly weak. Across the 50 states, the Pearson correlation between net domestic migration and Houzeo saved-search volume is r = 0.08 (95% CI −0.20 to 0.35), statistically indistinguishable from zero.
The rank correlation tells a different story: Spearman’s ρ = 0.38 (95% CI 0.12 to 0.60), a moderate and statistically significant relationship (p ≈ 0.006).
Together, they say something more precise than either alone: migration rank broadly predicts the order of search interest across states, but not its magnitude.
The near-zero linear correlation is driven almost entirely by California and New York, whose combined net outflow of 366,700 residents coexists with high search volume. Excluding those states raises the Pearson correlation to 0.50.
The U.S. Census Bureau’s 2025 population estimates provide the underlying migration benchmark, showing that 31 states recorded positive net domestic migration between July 2024 and July 2025.[1]
Redfin’s Q1 2026 report found that 19.1% of homebuyers searched for homes outside their metro area, the highest share since tracking began in 2021. [2] Realtor.com’s Cross-Market Demand Report found that 58.9% of online home shoppers searched outside their home metro in mid-2025, up from 48.1% pre-pandemic. [3]
These figures show that home-search behavior frequently extends beyond where people currently live, consistent with the broader finding of Houzeo’s migration report.
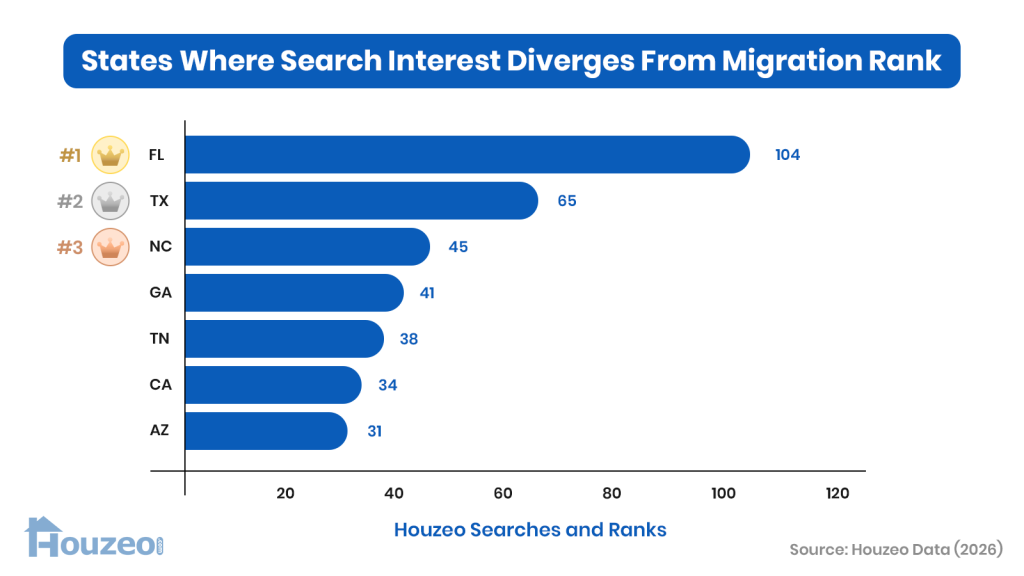
6 States Where Migration and Houzeo Search Activity Align
Six states fall into the high-migration, high-search quadrant, recording both positive domestic migration and high Houzeo saved-search activity. South Carolina (#3) and Alabama (#7) also recorded strong migration gains but fall below the median search threshold; both are covered in the divergence section below.
| State | Net Domestic Migration | Houzeo Saved Searches | Search Share | Migration Rank | Search Rank |
| Florida | +22,517 | 104 | 13.1% | 8 | 1 |
| Texas | +67,299 | 65 | 8.2% | 2 | 2 |
| North Carolina | +84,064 | 45 | 5.7% | 1 | 3 |
| Georgia | +27,333 | 41 | 5.2% | 6 | 4 |
| Tennessee | +42,389 | 38 | 4.8% | 4 | 5 |
| Arizona | +31,107 | 31 | 3.9% | 5 | 7 |
Florida stands out. Despite ranking only #8 in net migration, behind six other Southern and Mountain West states, Florida captures nearly 13.1% of all Houzeo buyer searches. (double of what we see with the second state, Texas). Potential explanations include interest from retirees, investors, vacation-home shoppers, but the dataset does not identify individual search motivations.
Florida’s 2025 net domestic migration of 22,517 is down 93% from its 2022 peak of 310,892, when it led the nation.
These six states also appear prominently in major migration datasets.
The National Association of Realtors’ February 2026 analysis of Census data found that 9 of the 15 states with the largest domestic migration gains were in the South. North Carolina is leading the nation at 84,064 net domestic movers. Affordability and economic growth are frequently cited as contributing factors. [1] [4]
Allied Van Lines likewise identified the Carolinas and Tennessee among its top inbound states for the fourth consecutive year. [5]
The fact that Houzeo’s own search data independently mirrors this pattern suggests overlap between Houzeo search behavior and broader migration patterns in the US, even though the relationship is weak when measured across the full dataset.
States Where Migration and Houzeo Search Activity Diverge
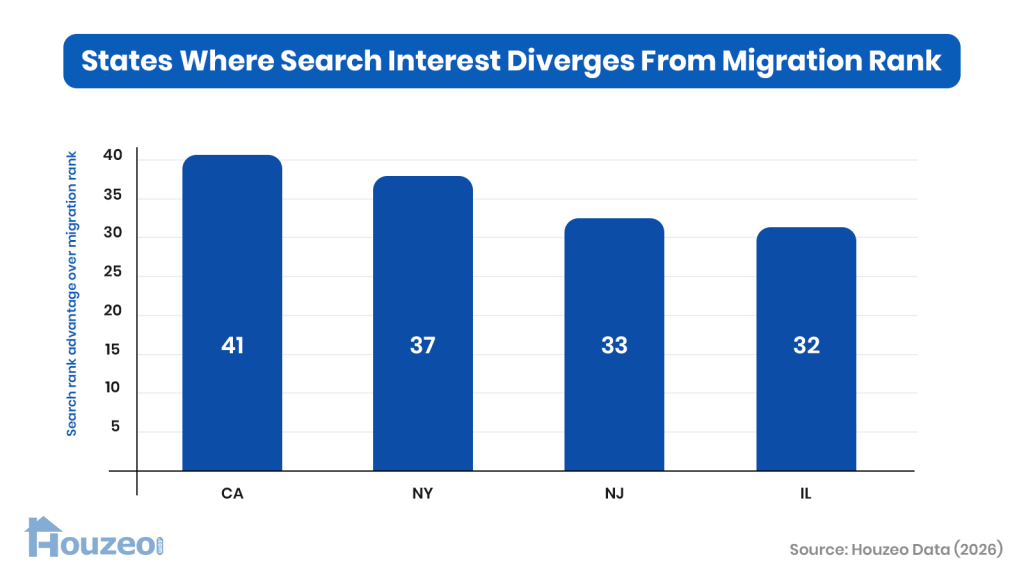
Some of the most interesting markets are those where search activity and migration tell contradictory stories. Two patterns emerge.
1. High Search Despite Outmigration: When People Leave but Buyers Keep Searching
Six states with significant domestic outmigration still generate heavy Houzeo buyer search activity:
| State | Net Domestic Migration | Migration Rank | Houzeo Search Rank | Rank Gap |
| California | -229,077 | 50 | 6 | +44 |
| New York | -137,586 | 49 | 8 | +41 |
| Illinois | -40,017 | 48 | 12 | +36 |
| New Jersey | -37,428 | 47 | 9 | +38 |
| Massachusetts | -33,300 | 46 | 20 | +26 |
| Pennsylvania | -2,900 | 39 | 15 | +24 |
California is the most extreme case. The state lost more domestic residents than any other: 229,077 in a single year. But it still ranked 6th in Houzeo search activity with 34 searches producing 236 inquiries and 39 offers.
California presents one of the largest gaps between migration rank and Houzeo search rank. However, Houzeo’s aggregated dataset does not identify the origin and destination of each search. As a result, the activity could reflect local California buyers using Houzeo to search for homes, inbound shoppers, investors, second-home buyers, or residents considering homes elsewhere.
External migration studies nevertheless show substantial outbound housing interest from several California metros, offering useful context for this divergence.
Redfin reports that San Jose had the highest share of outbound home searches of any U.S. metro in early 2026, with 93.7% of shoppers looking elsewhere. [2] MoveBuddha data shows Texas captures 14.1% of California’s outbound search interest, followed by Florida at 7.16%.[6]
The California Policy Lab found that Californians who relocate move to neighborhoods where monthly housing costs average $672 less.[7]
Partly. In Houzeo’s 2026 analysis of 793 buyer searches, net domestic migration and Houzeo search volume across the 50 states showed a Pearson correlation of 0.08; effectively zero, but a Spearman rank correlation of 0.38, which is moderate and statistically significant.
Migration rank broadly predicts the order of buyer interest across states, but not how much search activity a state generates. The gap is driven by large outbound markets: California and New York lost a combined 366,700 domestic residents in 2025 while ranking 6th and 8th in Houzeo search volume. Excluding those two states, the Pearson correlation rises to 0.50.
2. High Migration, Low Search: When Population Growth Doesn’t Become Search Activity
Conversely, several states with strong migration gains generate almost no Houzeo search activity:
| State | Net Domestic Migration | Migration Rank | Houzeo Search Rank | Rank Gap |
| South Carolina | +66,622 | 3 | 16 | -13 |
| Alabama | +23,358 | 7 | 18 | -11 |
| Idaho | +19,915 | 9 | 35 | -26 |
| Arkansas | +14,500 | 11 | 24 | -13 |
| Maine | +7,400 | 18 | 34 | -16 |
South Carolina is the clearest case. It ranked third nationally in net domestic migration and was the fastest-growing state in the country by percentage, yet it accounts for 2.4% of Houzeo saved searches. That’s less than a fifth of Florida’s share.
Alabama shows the same pattern at #7. Idaho produced the widest rank gap in the dataset: ninth in migration, thirty-fifth in search volume, on three saved searches.
These gaps most likely reflect Houzeo’s audience composition, geographic penetration, and listing inventory rather than underlying buyer demand. Wyoming and South Dakota recorded positive net migration and zero saved searches in the period, which illustrates the same limitation at its extreme.
How Affordability and Market Conditions Shape the Search Landscape
Housing costs, inventory conditions, and insurance expenses show why buyers search where they do, and why some migration destinations have more appeal than others.
1. The Search for Affordable Homes
Among the top 10 states by Houzeo search volume, median home prices range from $329,000 (Tennessee) to $746,890 (California). Several states with high inquiries-per-search ratios like Ohio (8.9x) and Pennsylvania (8.8x) also have comparatively lower home prices. This pattern is consistent with affordability being one possible factor associated with deeper buyer engagement, although the analysis does not establish causality.
The affordable-search relationship is visible in the budget data: 51.6% of all Houzeo buyer searches are set at or below $200,000. By comparison, the national median home sale price hovers around $400,000, per Houzeo’s August update.
Within this Houzeo sample, buyer budgets are concentrated well below the national median home price. This may reflect differences in Houzeo’s audience, inventory, geographic mix, or buyer preferences and should not be interpreted as representative of all U.S. homebuyers.
2. Why Florida’s Search Volume Doesn’t Directly Translate Into Transactions
Florida leads all states in Houzeo search activity, but its market conditions require careful interpretation. Several market conditions may complicate the path from buyer interest to completed transactions:
- Insurance costs: According to Insurance.com, average Florida homeowners insurance costs $8,471 a year at $300,000 dwelling coverage, 195% above the $2,872 national average. [8]
- Condo reserve mandates: Following the 2021 Surfside condominium collapse, Florida strengthened condo inspection and reserve requirements through Senate Bill 4-D. [9] The law requires many older condominium associations to complete Structural Integrity Reserve Studies (SIRS) and maintain funding for major repairs. For some buildings with significant deferred maintenance, these requirements have resulted in substantial special assessments, with documented cases exceeding $100,000 per unit. [10] [11] [12]
- Rising inventory: Florida’s housing market supply has soared to 6+ months (approx. 1.3 to 2.5 months more compared to 2024), with a median of 60+ days on market, per Houzeo. This marks a significant shift from the seller’s market of 2021–2022.
For market participants, this means that search volume should not be read as a direct predictor of transaction velocity. It is important to account for insurance, inventory, and affordability.
Where Buyers Search Is Only Half the Story
Migration tells us where buyers may be looking. Houzeo’s preference data reveals what they’re looking for: property types, bedroom counts, budgets, and lifestyle features. Our 2026 American Home Buyer Profile takes this one step further, examining the characteristics and preferences shaping today’s Houzeo buyer.
This dataset, covering 613 individual preference profiles, adds a behavioral layer that pure migration data cannot provide.
1. Property Types: Multi-Type Searches Dominate
According to Houzeo’s 2026 home buyer report, single-family homes accounted for 28.5% of all property-type selections.
Buyers searching Florida, Texas, and Georgia commonly selected combinations of single-family, townhouse, and condominium. Manufactured homes represented 14% of all property-type selections, while land accounted for 8.8%.
2. Buyers Are Watching the Price Tag
The median buyer budget across all Houzeo searches is $200,000, with a clear concentration at the affordable end:
| Budget Range | Share of Searches |
| Homes under $200,000 | 51.6% |
| $200,000–$300,000 | 16.5% |
| $300,000–$500,000 | 20.1% |
| $500,000–$750,000 | 6.2% |
| Above $750,000 | 4.8% |
Budgets vary significantly by state. California’s median buyer budget is $500,000, 2.5x the national Houzeo median.
Texas and Georgia buyers search at $200,000 and Florida and North Carolina buyers at $250,000. Arizona falls in the middle at $300,000.
3. What Buyers Want: AC, Basements, Pools and the Rest
Air conditioning leads all feature preferences (87 mentions), followed by washer-and-dryer (40), fireplace (32), basement (30), and backyard (26).
The 10 searches mentioning 55-plus communities are too few to establish a broad trend, but they provide a small signal worth monitoring in retirement-heavy markets such as Florida and Arizona.
Single-story homes (26 mentions), pool (27), and fixer-upper (13) round out the lifestyle. Buyers are interested in practical amenities, outdoor space, and a mix of move-in-ready and value-oriented properties.
The Missing Layer in Migration Data: Buyer Intent (From Search to Offer)
Houzeo’s platform tracks several stages of the digital buyer journey from initial search through inquiry, showing request, and offer. This funnel data reveals where saved-search activity is accompanied by higher levels of inquiry, showing, & offer activity; providing a behavioral layer that population-migration datasets generally do not capture.
| State | Saved Searches | Inquiries | Showings | Offers | Contact Agent | Inquiry per Saved Search |
| FL | 104 | 707 | 114 | 55 | 535 | 6.8x |
| TX | 65 | 332 | 39 | 13 | 277 | 5.1x |
| NY | 30 | 248 | 37 | 18 | 190 | 8.3x |
| CA | 34 | 236 | 34 | 39 | 157 | 6.9x |
| GA | 41 | 226 | 56 | 39 | 130 | 5.5x |
| NC | 45 | 210 | 74 | 16 | 118 | 4.7x |
| OH | 23 | 204 | 53 | 35 | 114 | 8.9x |
| NJ | 25 | 201 | 53 | 25 | 122 | 8.0x |
| MI | 21 | 168 | 41 | 36 | 89 | 8.0x |
| PA | 19 | 168 | 42 | 18 | 107 | 8.8x |
Nationwide totals: 6.1 inquiries per saved search. 793 searches generated 4,811 inquiries, 1,125 showings, and 501 offers.
The Search-to-Offer Story: What this Buyer Funnel Reveals
- Highest-engagement markets are not the highest-search markets: Ohio (8.9x inquiry ratio), Pennsylvania (8.8x), New York (8.3x), and New Jersey (8.0x) all generate far more inquiries per search than Florida (6.8x) or North Carolina (4.7x). These states record fewer saved searches but substantially more inquiries relative to search volume, indicating higher interaction intensity within the Houzeo sample.
- California’s offer count stands out: Despite ranking only 6th in searches, California produced 39 offers, tying with Georgia for the highest in the dataset after Florida (55). The reason for California’s relatively high offer count cannot be determined from the aggregated dataset because user origin, destination, and individual motivations are not identified.
- Florida’s funnel is wide and deep: With 104 searches, 707 inquiries, 114 showings, and 55 offers. The 6.8x inquiry ratio is strong, and the 55 offers represent the highest absolute count in the dataset. Despite Florida’s insurance, affordability, and inventory challenges, it still recorded the highest saved-search and offer counts in Houzeo’s sample.
Zooming In: Which Cities Are Houzeo Buyers Looking At
While state-level data reveals broad patterns, city-level Houzeo search data shows where buyer interest concentrates within those states.
These figures represent Houzeo platform search activity, not migration data (county-level migration data is not included in this dataset). City rankings represent Houzeo search activity, not population migration. These results should therefore be treated as exploratory rather than as rankings of overall city-level housing demand.
| City | State | Saved Searches | Inquiries |
| San Antonio | TX | 11 | 43 |
| Mesa | AZ | 7 | 4 |
| Las Vegas | NV | 7 | 17 |
| Orlando | FL | 7 | 0 |
| Oklahoma City | OK | 6 | 29 |
| Raleigh | NC | 5 | 6 |
| Columbus | OH | 5 | 20 |
| Los Angeles | CA | 4 | 6 |
| Tulsa | OK | 4 | 5 |
| Clarksville | TN | 4 | 4 |
| Houston | TX | 4 | 22 |
| Toledo | OH | 4 | 21 |
The Markets Hiding in Plain Sight: What The City Data Reveals
- Secondary cities stand out: The top city by Houzeo searches is San Antonio, not Houston, not Dallas, not Miami. This is directionally consistent with broader migration patterns toward more affordable secondary metros, per Allied Van Lines’ 2025 report. [5] Bank of America Institute data showed continued population inflows into cities such as San Antonio, Austin, Las Vegas, Indianapolis, and Columbus, while affordability remained an important factor shaping relocation patterns. [13]
- Ohio has more inquiries compared to searches: Columbus (5 searches, 20 inquiries) and Toledo (4 searches, 21 inquiries) both convert at very high rates. Ohio’s statewide 8.9x inquiry ratio is the highest in the dataset, and the city data confirms this pattern.
- Orlando searches without inquiries: Orlando generated 7 saved searches but 0 inquiries, which may reflect an early-stage exploration rather than purchase intent. The sample is too small to determine why those searches did not progress, but external market data provides useful context. Orlando has a substantial vacation-home and short-term-rental segment, where higher operating costs and softer rental demand have created challenges for property owners and investors. At the same time, insurance, taxes, HOA costs, and broader affordability pressures continue to raise the cost of homeownership across Central Florida. [14] [15] [16]
Migration Report Methodology & Limitations
This analysis combines anonymized and aggregated Houzeo buyer activity data with publicly available housing and migration datasets to examine how digital home-search behavior compares with domestic migration patterns. It was conducted by Jai Chavan, Digital Marketing Manager at Houzeo, who researches housing market trends, consumer behavior, and digital real estate using proprietary Houzeo platform data and public housing datasets.
The Houzeo dataset includes a set of buyer searches, inquiries, showings, offers, and property preferences recorded from January through September 2026, across 47 U.S. states, Washington D.C., and Puerto Rico. The study is designed to identify directional patterns in digital buyer behavior, not to estimate total U.S. housing demand.
Houzeo Sample Data Selection: The study analyzed 793 saved searches from Houzeo’s buyer activity data from January through September 2026. Searches were first filtered to include only eligible registered-buyer saved searches with at least one active search criterion. From this eligible pool, records were randomly selected. The sample is intended to identify directional patterns within Houzeo’s user base and is not nationally representative.
Migration comparisons use U.S. Census Bureau domestic migration estimates for the July 2024–July 2025 period. Additional housing market context is sourced from publicly available industry datasets referenced throughout the report.
Houzeo platform data reflects behavior among Houzeo users and should not be interpreted as a national survey of all U.S. home buyers. Search activity indicates buyer interest and exploration but does not confirm relocation, purchase decisions, or the motivations behind individual searches. City-level findings represent Houzeo search activity and not population migration.
No personally identifiable information is included. All findings are based on aggregated platform activity analyzed in accordance with Houzeo’s Privacy Policy.
Our Data Sources
- Houzeo Marketplace Data: This study analyzes 793 buyer saved searches, 4,811 property inquiries, 1,125 showing requests, and 501 offers recorded on the Houzeo platform. A “search” is defined as a saved home search with at least one filter (location, price, property type, or feature) applied by a registered buyer on houzeo.com, not every home-search query or page view. The analysis period covers searches recorded from January through September, and only considers those that are active at the time this dataset was extracted. Buyer preference data (613 individual profiles) includes property type, bedroom count, budget ceiling, square footage, and feature selections.
- U.S. Census Bureau: Net domestic migration estimates are drawn from the Census Bureau’s annual state population estimates, vintage 2025, measuring net domestic movement from July 1, 2024 to July 1, 2025. These figures count moves between U.S. states and exclude international migration and natural population change (births minus deaths).
- Housing Market Data: Median listing prices, days on market (DOM), inventory levels, new listings, and price-drop percentages are sourced from Houzeo’s housing market pages (updated as of July and August 2026.)
Geographic Coverage
The dataset includes 47 of 50 U.S. states, the District of Columbia, and Puerto Rico. Connecticut, Wyoming and South Dakota were excluded from the Houzeo dataset due to zero recorded buyer searches in the analysis period.
Puerto Rico and Guam appear in Houzeo search activity but are excluded from migration comparisons and all rankings, as Census state-level domestic migration estimates do not cover territories. Alaska and Mississippi are included in both.
Statistical Methods
The migration-search comparison is computed across all 50 states (n = 50). Puerto Rico, Guam and the District of Columbia are excluded from correlations and rankings. Two coefficients are reported: the Pearson product-moment correlation (r = 0.08) measures linear association between migration volume and search volume, and the Spearman rank correlation (ρ = 0.38) measures whether the two measures order states similarly.
Pearson is reported because it is the conventional measure; Spearman is reported because search counts range from 0 to 104 across states and are heavily right-skewed, which makes the linear coefficient sensitive to a small number of large-volume states. State ranks are computed independently for each measure, descending, over the same 50 states.
The “rank gap” is Migration Rank minus Search Rank; a positive gap indicates the state ranks higher in search than in migration. Category labels (“High migration + high search,” etc.) use x = 0 net migration as the migration threshold and the median search count as the search threshold.
Limitations
- Houzeo search data reflects activity on a single platform. Houzeo is a real estate marketplace that offers services for buyers and sellers, but may not be representative of all homebuyers. As with any report based on behavioral data, the findings represent patterns among Houzeo’s digital home-shopping audience rather than a national survey of all buyers.
- Search activity captures digital exploration, not confirmed purchases or relocations. A search set in Florida by a California resident reflects intent to browse, not intent to move.
- The dataset does not distinguish between searches by local residents and searches by out-of-state buyers.
- City-level data reflects Houzeo search activity only. County-level migration data is not included in this analysis; city findings should not be described as migration patterns in US.
- The 793-search sample is directionally useful but modest in absolute terms. Findings describe observed patterns in Houzeo data and should not be generalized as nationally representative without qualification, especially for city-level conclusions.
External Sources
5. Allied Van Lines, “Where Are People Moving to in 2025? Allied’s U.S. Migration Report,” 2025
8. Insurance.com, “Average home insurance rates by state in 2026,” September 15, 2026
13. Bank of America, “On the move: More movers, fewer homebuyers,” May 2025
About Houzeo Research
Houzeo Research analyzes proprietary real estate platform data alongside public housing, demographic, and economic datasets to identify emerging trends in how Americans search for, buy, sell, and value real estate. By combining real-time consumer behavior with housing-market data, Houzeo Research aims to provide a closer look at the decisions and patterns shaping the U.S. housing market.
Our research uses anonymized and aggregated platform data. Individual users are never identified, and findings are presented with methodology and limitations to distinguish observed behavior from broader national trends.
Reports By Houzeo:
The 2026 Home Buyer Report: What 1,500+ Houzeo Buyer Actions Reveal