Skip to Main Content

Inverness Highlands South, FLHousing Market

Inverness Highlands South is moving fast, and is a seller's market. Just 3.7 months of supply and 30 days on the market mean less competition for buyers and more leverage for you.

author image
Written By Jai CDigital Marketing Manager
broker Image
Reviewed By Dan FReal Estate Broker
Verified Data
Updated Monthly
Fast Insights
Real-time Analytics
March 2026
Last updated
Live MLS Data 68 active homes tracked
Data Sources:
Stellar MLS-FL
Inverness Highlands South, FL Real Estate Market Snapshot
MEDIAN HOME PRICE
$249,995↑ 0.12%
MORTGAGE RATES 30-YR
6.23%↓ 0.58%
Seller's Market
DAYS ON MARKET
30
↓ 65.00% YoY
INVENTORY
52
↑ 0.02% YoY
Overview icon Overview
Predictions icon Predictions
Supply icon Supply
Demand icon Demand

Is Now a Good Time to Sell in Inverness Highlands South? Here's What We Think.

Yes, now is a good time to sell in Inverness Highlands South. Homes are spending just 30 days on the market on average, while supply remains tight at 3.7 months. The median sale price of $249,995, with home sales seeing no change from last year, sellers can take advantage of an active market with strong buyer demand.
Median Sale PriceHomes SoldMedian Days on Market
Median Sale Price
$249,995
↑ 0.12%YoY
What this chart showsMedian Sale Price
This metric shows how home prices are trending in Inverness Highlands South. The median sale price is currently $249,995, a marginal change from last year. A rising median price can point to stronger demand or limited inventory, while a falling price may give buyers more room to negotiate.

Median Sale Price Trend

AllSingle Family HomesTownhousesCondo
1 Year3 Years5 Years

Inverness Highlands South
location pin
Updated MonthlyLast Updated: March 2026

Inverness Highlands South Housing Market Forecast for 2026

Inverness Highlands South's housing market is expected to favour sellers in 2026, with steady price growth, tight inventory, and homes selling quickly.

Market Outlook:

  • Home prices expected to rise by 2-4%, supported by strong demand
  • Months of supply forecast to stay tight at around 4-6, giving sellers the upper hand on price
  • Fast-moving homes and low supply keep pricing leverage with sellers

Will the Inverness Highlands South Housing Market Crash in 2026?

Expert consensus points to no. Inverness Highlands South benefits from strong buyer demand and limited housing supply, conditions that support prices rather than undermine them. Sellers should expect continued interest and quick sales through 2026, with little pressure to discount.
UnlikelyCrash MeterLikely

Current Market Indicators

  • Days on Market:

    30 days

  • Months of Supply:

    3.7 months

  • Sale-to-List Ratio:

    97.75%

  • Mortgage Rates:

    Currently- 6.23% projected to hover between 6.0% and 6.8%

Is There Enough Inventory in Inverness Highlands South Right Now?

Inventory remains tight in Inverness Highlands South, keeping competition high among buyers. With 52 active listings and just 3.7 months of supply, sellers have less competition and more pricing leverage. There were 19 new listings last month, while the inventory had a marginal change year-over-year.
Homes for SaleNewly Listed HomesMonths of Supply
Homes for Sale
52
↑ 0.02%YoY
What this chart showsHomes for Sale
This chart shows the total number of homes currently available for sale in Inverness Highlands South. There are currently 52 active listings. Rising inventory gives buyers more options, while fewer homes for sale can increase competition and give sellers more leverage.

Homes for Sale Trend

AllSingle Family HomesTownhousesCondo
1 Year3 Years5 Years

Inverness Highlands South
location pin
Updated MonthlyLast Updated: March 2026

Are Buyers or Sellers Controlling the Inverness Highlands South Market?

Sellers currently have the upper hand in the Inverness Highlands South housing market. Homes are selling for 97.75% of their asking price, and price reductions saw a 18.29% change year-over-year. Limited discounting and strong sale prices give sellers more leverage when negotiating.
Homes Sold Above List PriceHomes with Price DropsSale-to-List Ratio
Homes Sold Above List Price
7.14%
↓ 17.86%YoY
What this chart showsSold Above List
The line tracks the share of homes in Inverness Highlands South selling above their asking price over time. Currently, 7.14% of homes sold above asking last month. A rising trend signals strong buyer competition and bidding wars, while a falling trend suggests that competition is easing.

Homes Sold Above List Price Trend

AllSingle Family HomesTownhousesCondo
1 Year3 Years5 Years

Inverness Highlands South
location pin
Updated MonthlyLast Updated: March 2026

Find Your Perfect Inverness Highlands South Home Now

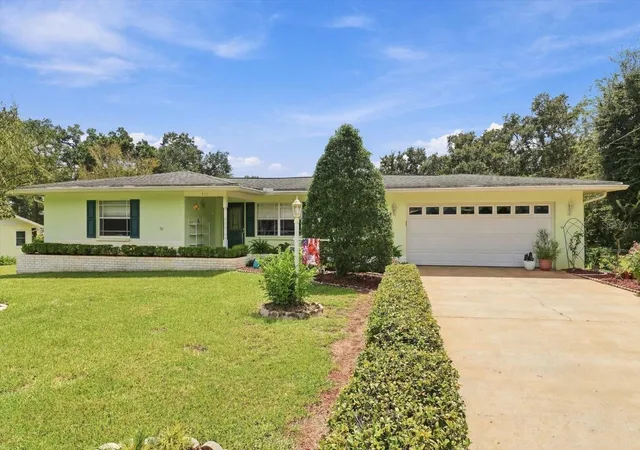
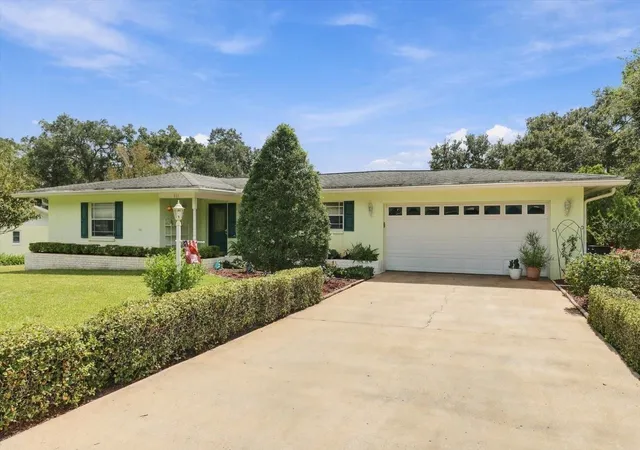
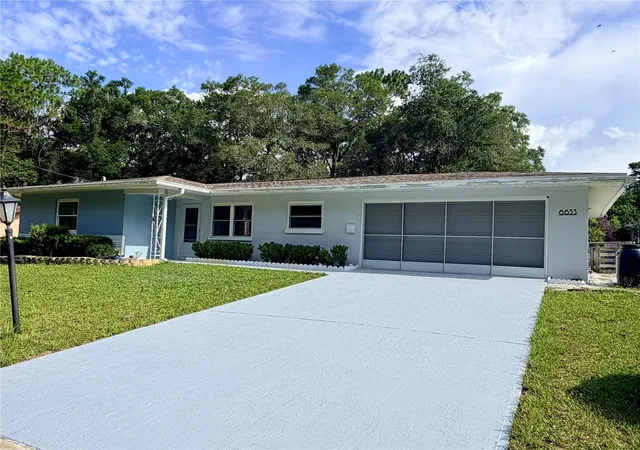
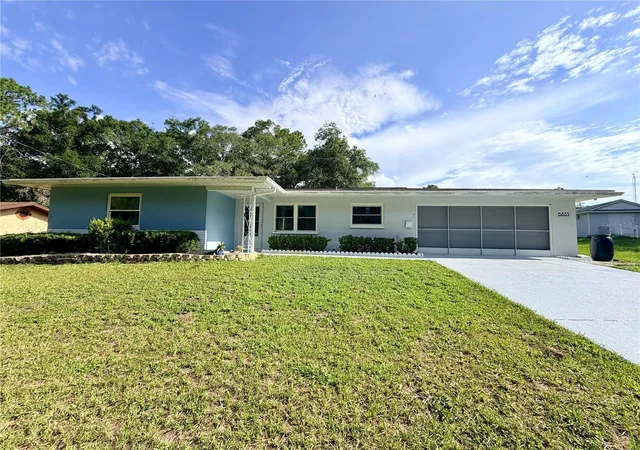
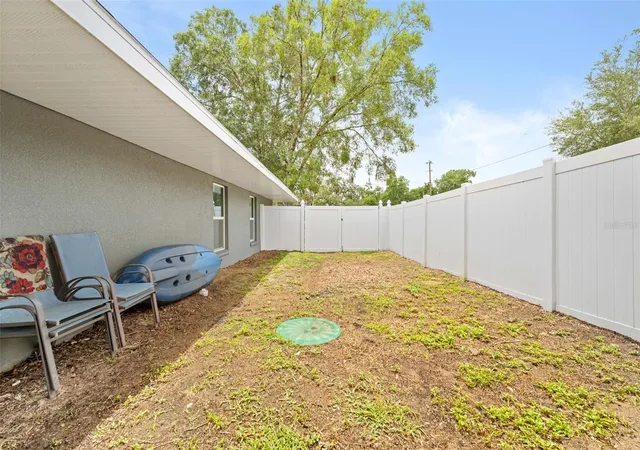
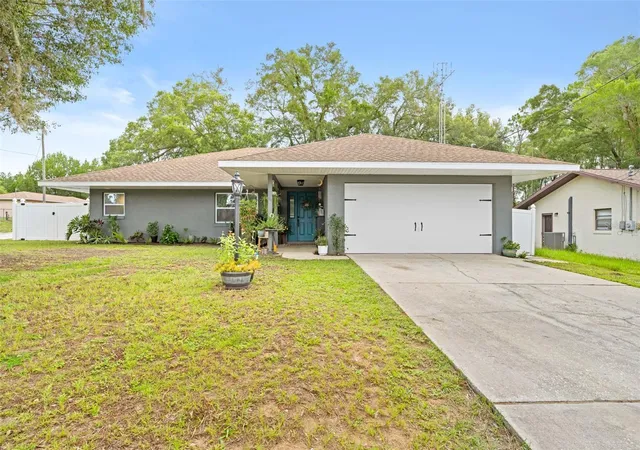
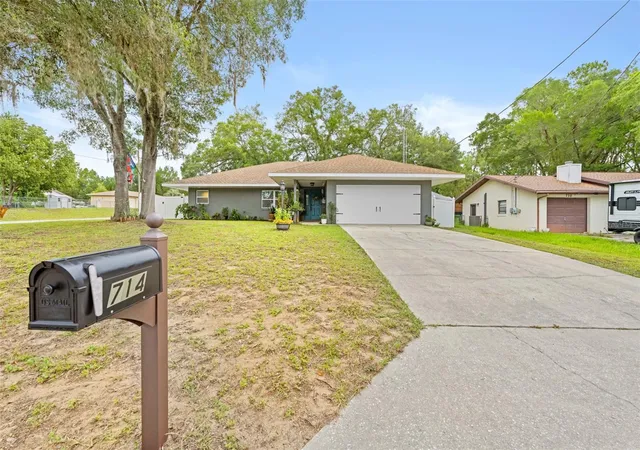
68 homes for sale in Inverness Highlands South, FL big arrow leftbig arrow inline

Download App Download the App Now!

  • 4.8-star mobile app

  • Browse 1.6 million listings

  • Get instant alerts for new homes

  • List homes on the go

  • Manage showings and submit offers

PlayStoreAppStore

Frequently Asked Questions

How have Inverness Highlands South house prices changed over the past year?

What are Inverness Highlands South real estate market predictions for 2026?

What's the average home price in Inverness Highlands South?

What is a good time to buy a home in Inverness Highlands South?

When will the Inverness Highlands South housing market crash?

How to buy a home in Inverness Highlands South?

How can I list my home for sale in Inverness Highlands South, FL?

What is the average mortgage rate for buyers in Inverness Highlands South?

What is a good time to sell a house in Inverness Highlands South?

Our MLS data sources

All sources updated daily

Median prices, rents and active inventory aggregated from MLS systems across Florida.

Stellar MLS-FL
Stellar MLS-FL
Beaches MLS-FL
Beaches MLS-FL
Bay/Panama City/Central Panhandle MLS-FL
Florida Gulf Coast MLS, Fort Myers-FL
Miami MLS-FL
Miami MLS-FL
Space Coast MLS (Space Coast Association of REALTORS®)-FL
Northeast Florida (realMLS) MLS-FL
Pensacola AOR MLS-FL

Data provided by Redfin, a national real estate brokerage.

Important Legal Disclosures

*Based on Houzeo calculations of home data from MLS and/or public records.

“The market analysis provided on this page is for informational purposes only and does not constitute financial, investment, or legal advice. Data is sourced from public records, industry reports, and third-party providers, and while Houzeo strives for accuracy, we make no guarantees regarding the completeness, accuracy, or timeliness of the information presented.

All estimates, projections, and historical data are based on statistical models and should not be relied upon as predictions of future market conditions. Past performance is not indicative of future results, and real estate market conditions may change due to various economic and regulatory factors.
Users are responsible for conducting their own due diligence before making any real estate or financial decisions. Houzeo is not liable for any decisions or actions taken based on the information provided. Any unauthorized use, duplication, or distribution of the data may violate copyright laws and result in legal consequences. Certain information, tools and services on this page may be powered by third-party vendors. Houzeo does not control or guarantee the accuracy, reliability, or functionality of such third-party services.

mls-img
Based on information from Stellar MLS® through Oct 7, 2026, 6:00 AM as submitted to and distributed by MLS GRID. All data is obtained from various sources and may not have been verified by the broker or MLS GRID. Supplied Open House Information is subject to change without notice. All information should be independently reviewed and verified for accuracy. Properties may or may not be listed by the office/agent presenting the information. IDX information is provided exclusively for consumers’ personal non-commercial use. It may not be used for any purpose other than to identify prospective properties consumers may be interested in purchasing. The data is deemed reliable but is not guaranteed by MLS GRID. The use of the MLS GRID Data may be subject to an end-user license agreement prescribed by the Member Participant’s applicable MLS, if any, and as amended from time to time. © 2026 Stellar MLS. All Rights Reserved.