Safest Places to Live in Massachusetts
Massachusetts ranks among the most educated and affluent states, but it still faces crime concerns. The property crime rate sits at about 10.5 incidents per 1,000 people, and nearly 46% of residents say they worry about safety. From a Boston brownstone to a Worcester suburb, buyers value security more than ever. For safe and peaceful living, explore Houzeo's list of the safest places in the Bay State.


 Rankings
 Find Your Home
 For Retirees
 For Families
 For Young Adults
 FAQs
FAQsRankings: 10 Safest Places in Massachusetts

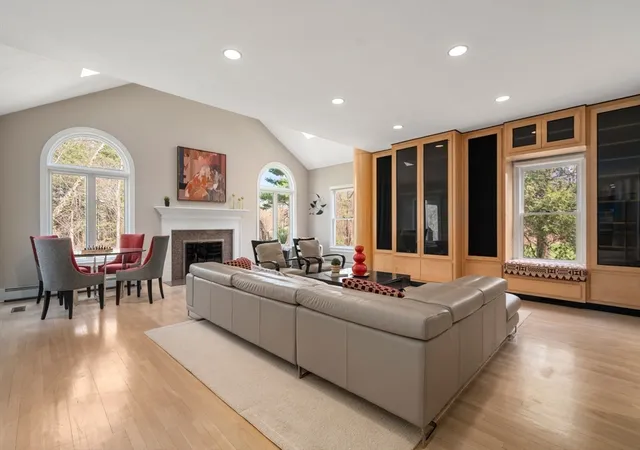
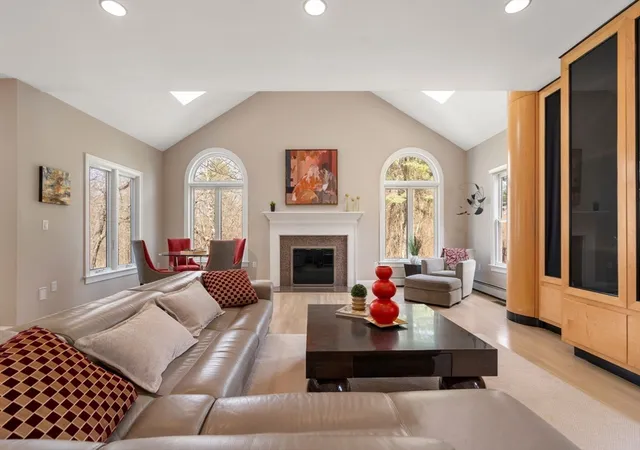
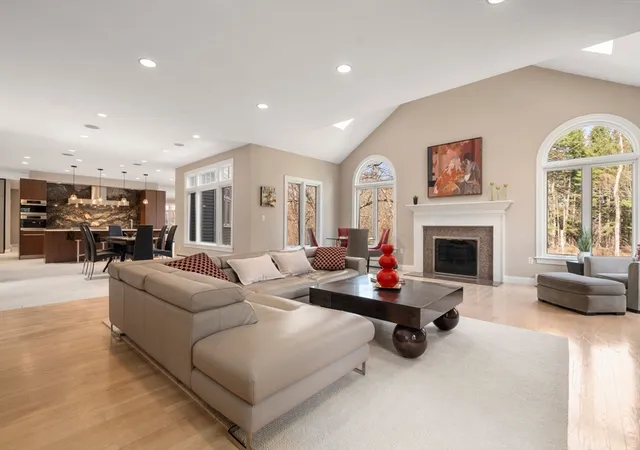
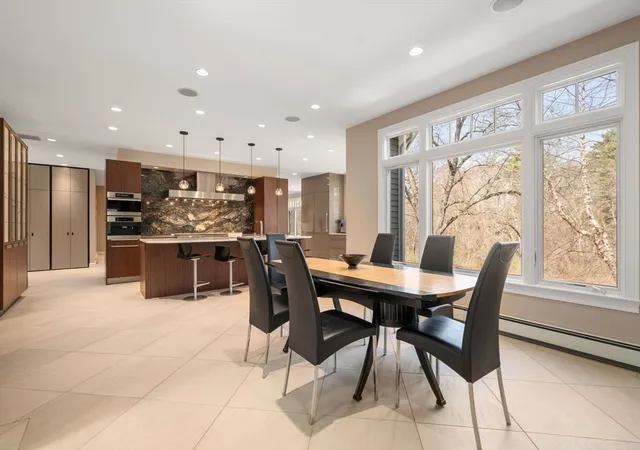
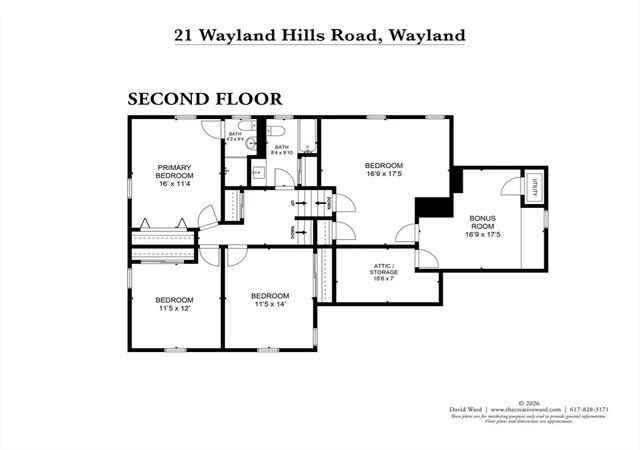
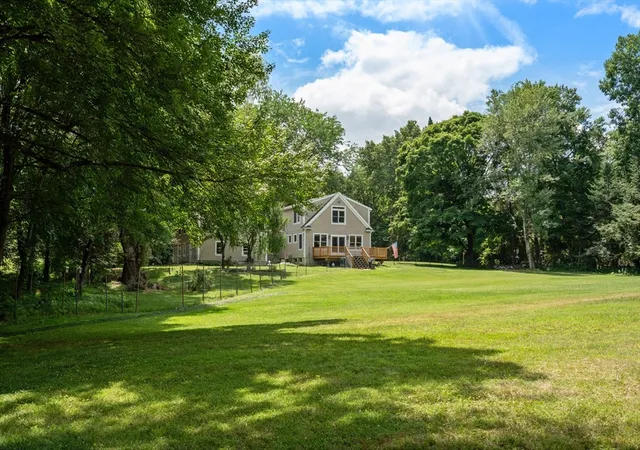
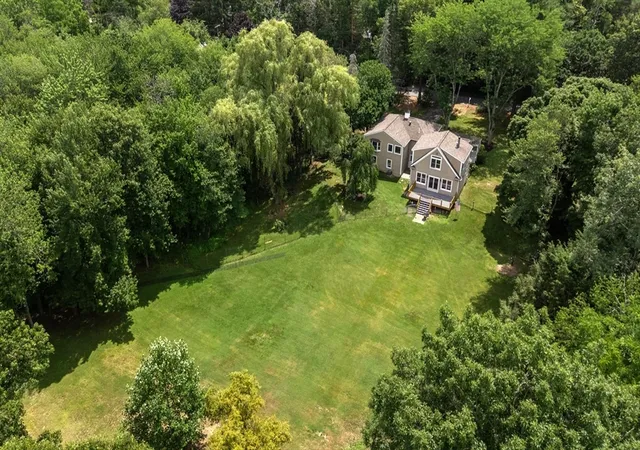
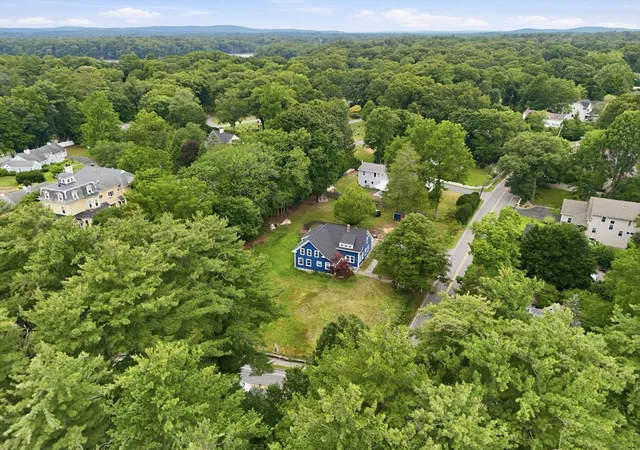
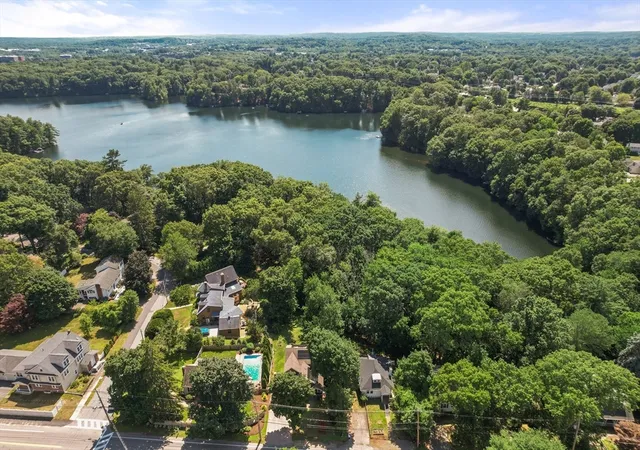
Wayland is one of the safest Massachusetts towns with a record that reflects its quiet, residential character. Violent crime here is rare, and the Wayland Police Department keeps consistent coverage across its largely suburban and wooded neighborhoods. Wayland High School is well-regarded and serves as a real anchor for family life in town. The Sudbury River runs along its western edge, giving residents shared natural space that keeps community life grounded. People tend to stay in Wayland for years, and that long-term investment shows in how attentive and connected the neighborhoods feel.
Wayland is one of the safest Massachusetts towns with a record that reflects its quiet, residential character. Violent crime here is rare, and the Wayland Police Department keeps consistent coverage across its largely suburban and...

Personal Safety : 95


Property Safety : 94

Community Safety : 95

$1,095,000
Median Home Rent
$5,000

Westford is a Middlesex County town that has kept crime low while growing into a sought-after suburban destination. The Westford Police Department runs proactive community programs that keep residents informed and involved in local safety. Westford Academy is one of the stronger public high schools in the state and draws families who plan to stay long term. The town has a mix of established neighborhoods and newer developments, both of which maintain a calm, residential feel. The lack of high-density commercial strips keeps transient traffic low.
Westford is a Middlesex County town that has kept crime low while growing into a sought-after suburban destination. The Westford Police Department runs proactive community programs that keep residents informed and involved in loca...
Personal Safety : 98
Property Safety : 97
Community Safety : 92
$984,900
Median Home Rent
$2,966

Northborough is a small Worcester County town that has built a quiet reputation for safety over the years. The Northborough Police Department runs consistent patrols across its suburban neighborhoods, and residents tend to be long-term homeowners who know their streets well. Algonquin Regional High School serves the community and keeps younger residents engaged locally. The town has no major commercial corridors that tend to pull in outside activity, which keeps things predictably calm. Solomon Pond Mall sits nearby in Marlborough, offering convenient retail without disrupting the town's residential character day to day.
Northborough is a small Worcester County town that has built a quiet reputation for safety over the years. The Northborough Police Department runs consistent patrols across its suburban neighborhoods, and residents tend to be long...
Personal Safety : 99
Property Safety : 92
Community Safety : 92
$681,000
Median Home Rent
$2,400

Arlington sits between Cambridge and Lexington and manages to hold a notably better safety record than its more urban neighbors. The Arlington Police Department has invested consistently in community policing, and crime figures have stayed low as a result. Spy Pond and the Minuteman Bikeway give residents shared outdoor spaces that keep community life active without requiring a car. Arlington High School serves the town well and keeps younger residents engaged locally. The town has a diverse, educated population that tends to be genuinely invested in the character and safety of its neighborhoods.
Arlington sits between Cambridge and Lexington and manages to hold a notably better safety record than its more urban neighbors. The Arlington Police Department has invested consistently in community policing, and crime figures ha...
Personal Safety : 97
Property Safety : 91
Community Safety : 94
$1,015,000
Median Home Rent
$2,500

Franklin is a Norfolk County town that manages a strong safety record despite being one of the larger communities on this list. The Franklin Police Department is well-staffed and runs consistent neighborhood patrols that residents notice and appreciate. Dean College adds an educated, steady presence to the town without significantly shifting its residential character. Franklin is served by a well-regarded public school system that keeps families rooted and invested. The town's commuter rail connection to Boston makes it practical without making it feel like an extension of the city.
Franklin is a Norfolk County town that manages a strong safety record despite being one of the larger communities on this list. The Franklin Police Department is well-staffed and runs consistent neighborhood patrols that residents...
Personal Safety : 93
Property Safety : 97
Community Safety : 89
$690,000
Median Home Rent
$2,400

Clinton is a small Worcester County town that punches above its weight when it comes to community safety. The Clinton Police Department keeps active coverage across its compact layout, and the town's size means response times are quick and faces stay familiar. Clinton High School anchors student life and gives families a reason to stay invested in the community long term. Among the town's quieter assets is the Wachusett Reservoir nearby, which naturally keeps the area from becoming too dense or commercially driven. That restraint shows in how settled Clinton feels.
Clinton is a small Worcester County town that punches above its weight when it comes to community safety. The Clinton Police Department keeps active coverage across its compact layout, and the town's size means response times are ...
Personal Safety : 83
Property Safety : 100
Community Safety : 97
$415,000
Median Home Rent
$1,944

Wellesley is an affluent Norfolk County town with one of the stronger safety profiles in the greater Boston area. The Wellesley Police Department is well-resourced and maintains a visible, community-oriented presence across the town's well-kept residential streets. Wellesley College brings an educated, engaged presence to the community without pulling it away from its residential character. Newton-Wellesley Hospital is close by for healthcare needs. The town's stable housing market and highly invested resident base create neighborhoods that stay calm, attentive, and safe through every season.
Wellesley is an affluent Norfolk County town with one of the stronger safety profiles in the greater Boston area. The Wellesley Police Department is well-resourced and maintains a visible, community-oriented presence across the to...
Personal Safety : 90
Property Safety : 94
Community Safety : 89
$1,825,000
Median Home Rent
$4,250

Newton is one of the safest cities in Massachusetts, built upon decades of stable, community-focused investment. The Newton Police Department runs well-organized community programs across the city's thirteen distinct villages, each of which carries its own neighborhood identity. Newton-Wellesley Hospital sits right in the city for reliable healthcare access. Newton North and Newton South High Schools are both highly regarded across the state. The city's educated, multi-generational resident base keeps neighborhoods feeling accountable, connected, and consistently safe year round.
Newton is one of the safest cities in Massachusetts, built upon decades of stable, community-focused investment. The Newton Police Department runs well-organized community programs across the city's thirteen distinct villages, eac...
Personal Safety : 95
Property Safety : 86
Community Safety : 91
$1,450,000
Median Home Rent
$3,600

Wakefield sits just north of Boston in Middlesex County and holds a safety record that outperforms many of its neighbors closer to the city. The Wakefield Police Department keeps active coverage across the town's compact layout, and crime figures here stay well below state averages. Lake Quannapowitt sits at the heart of town and gives residents a shared outdoor space that keeps community life active year-round. MelroseWakefield Hospital provides local healthcare. It is one of the safest towns in Massachusetts that keeps residents connected to each other.
Wakefield sits just north of Boston in Middlesex County and holds a safety record that outperforms many of its neighbors closer to the city. The Wakefield Police Department keeps active coverage across the town's compact layout, a...
Personal Safety : 87
Property Safety : 91
Community Safety : 87
$810,500
Median Home Rent
$2,500

Brookline is an inner suburb that borders Boston on three sides yet maintains a safety profile that stands apart from its larger urban neighbor. The Brookline Police Department is well-funded and runs strong community engagement programs across its dense, walkable neighborhoods. Coolidge Corner gives residents a lively commercial district with local restaurants and independent shops that keep streets active and well-trafficked. Beth Israel Deaconess Medical Center is close by bordering Longwood Medical Area. The town's highly educated, long-term resident base creates a community culture that takes neighborhood safety seriously.
Brookline is an inner suburb that borders Boston on three sides yet maintains a safety profile that stands apart from its larger urban neighbor. The Brookline Police Department is well-funded and runs strong community engagement p...
Personal Safety : 86
Property Safety : 86
Community Safety : 90
$1,515,000
Median Home Rent
$4,350
Transparent & data-driven
How We Ranked the Safest Cities
Each city is scored against the national average across three weighted categories, built entirely from FBI NIBRS crime data spanning 18 offense categories. Every metric is converted to a per-capita rate and a common 0–100 scale, so no single offense can dominate — and a city served by a non-reporting agency is never treated as crime-free.
Scoring weights
- Personal Safety50%
Homicide, rape, robbery, aggravated assault, kidnapping & human trafficking vs. the national rate.
- Property Security30%
Burglary, larceny, motor vehicle theft, arson & theft from buildings or vehicles vs. the national rate.
- Community Order20%
Simple assault, sex offenses, stolen property, vandalism, weapon & drug violations — the tiebreaker.
Our data source
Recalculated as each new annual NIBRS reporting year is released · agency-to-city mappings refresh quarterly.
Your New Home is Waiting for You in Massachusetts

 3
3
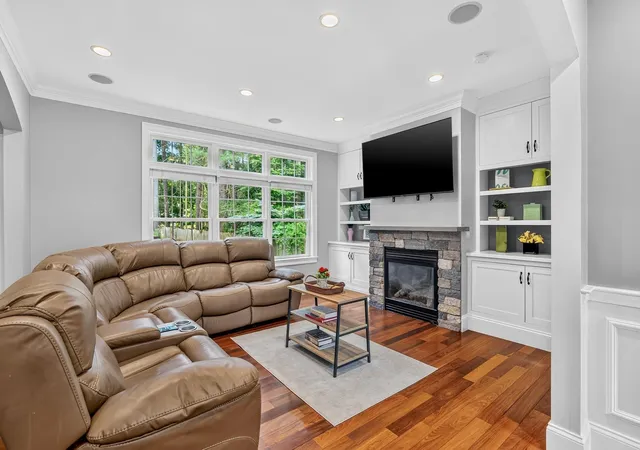
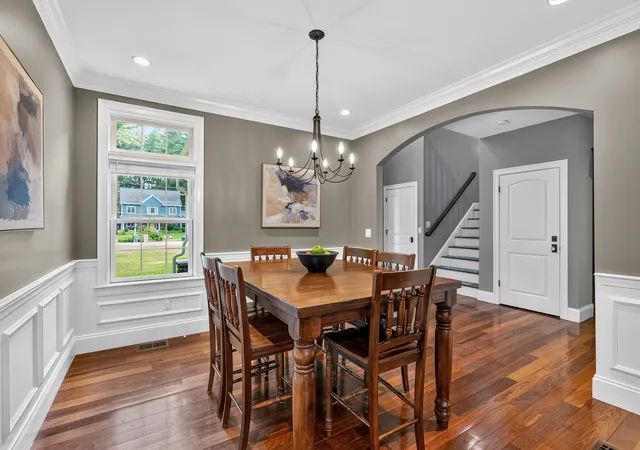
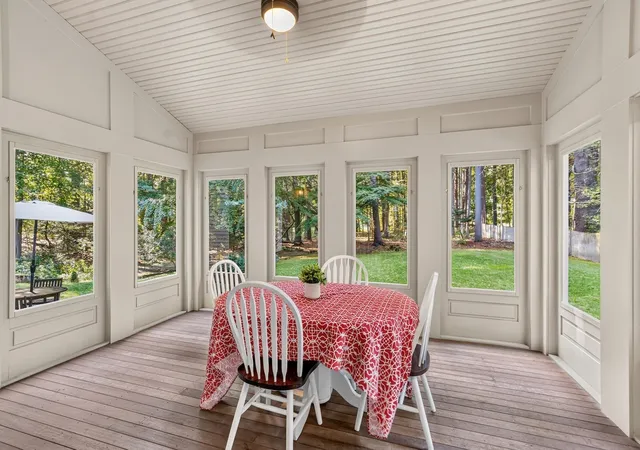
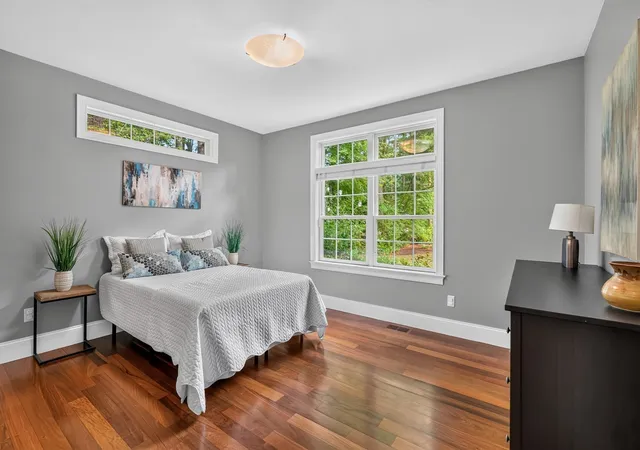
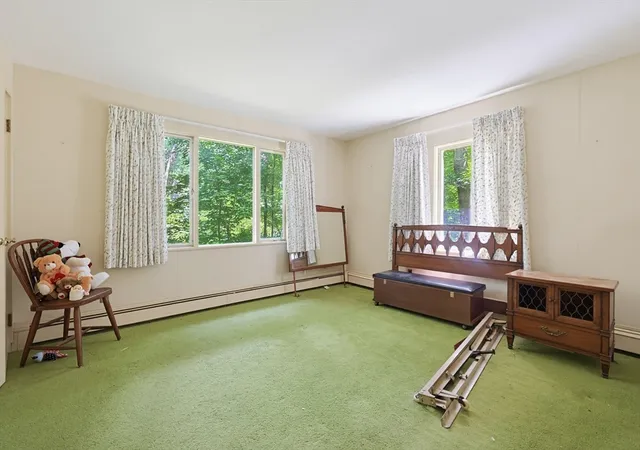
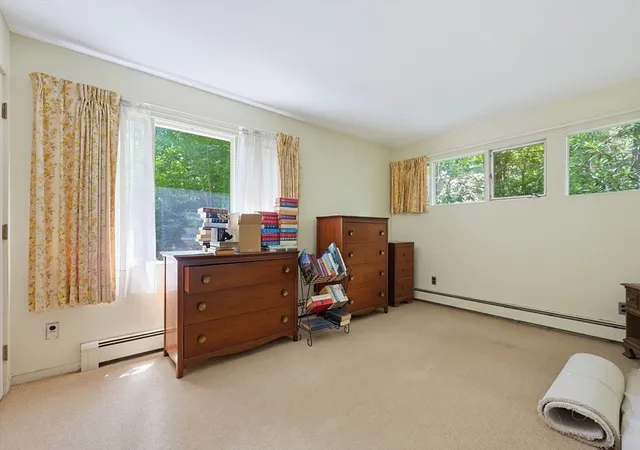
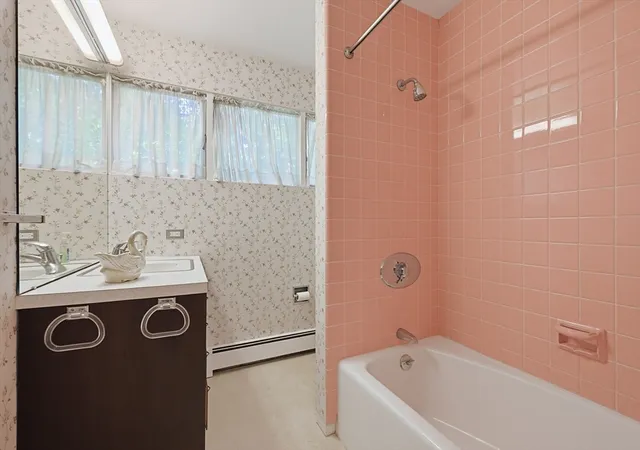
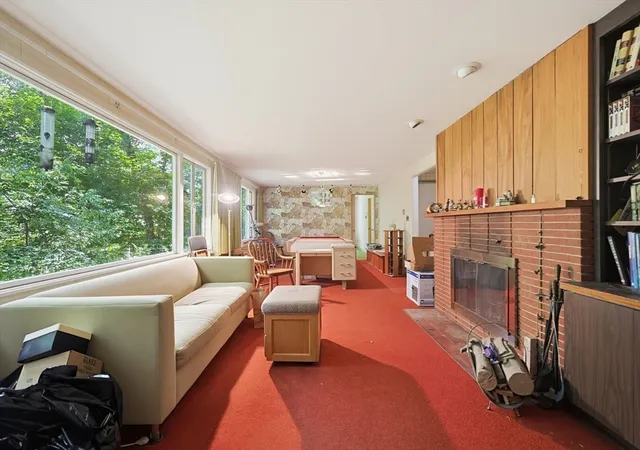


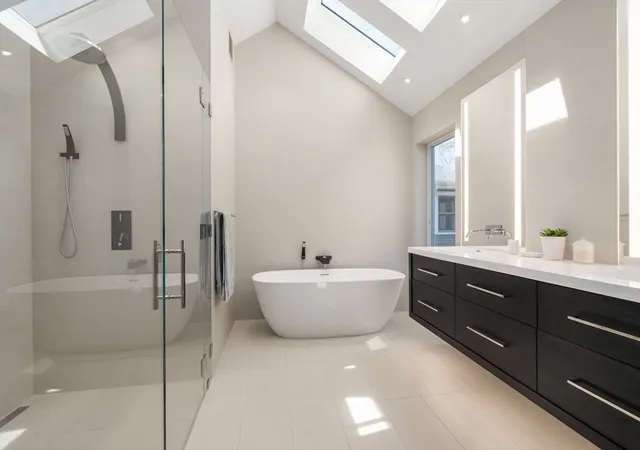
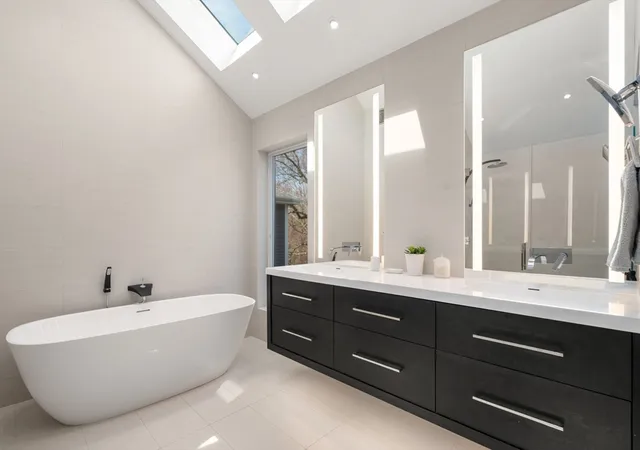
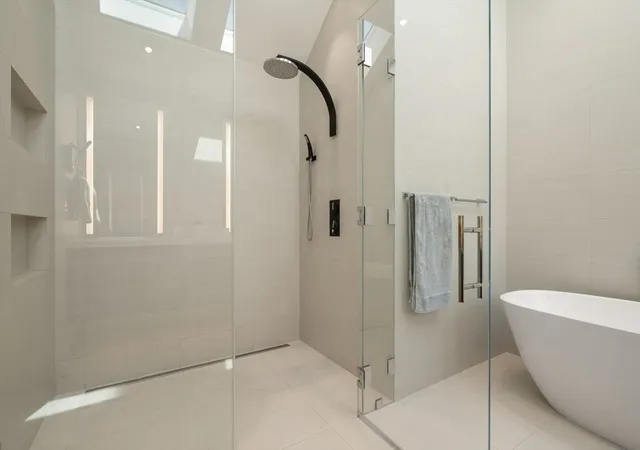
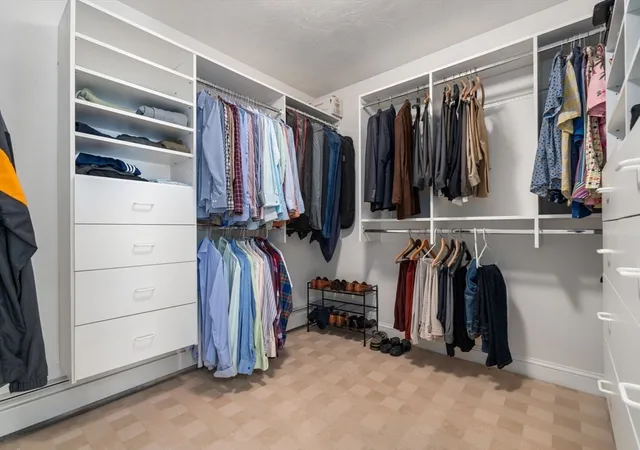

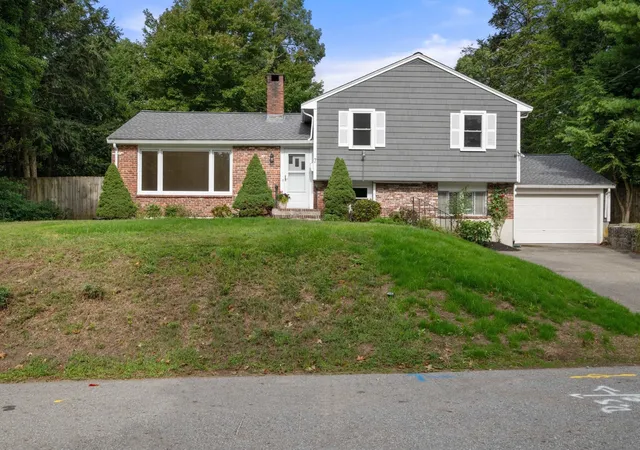
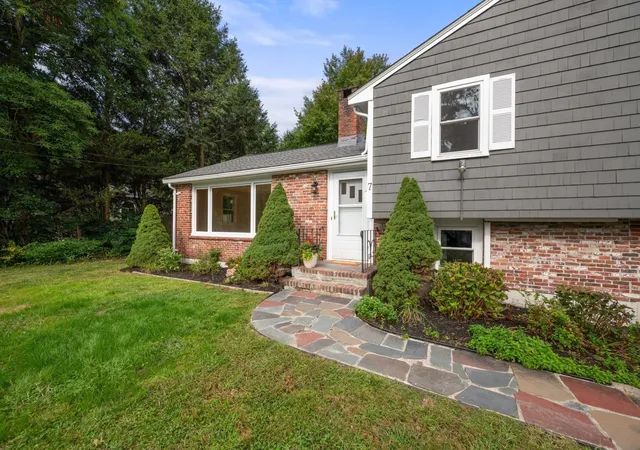
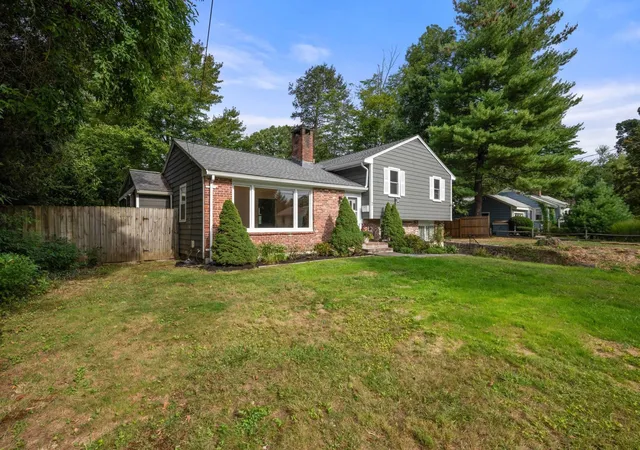
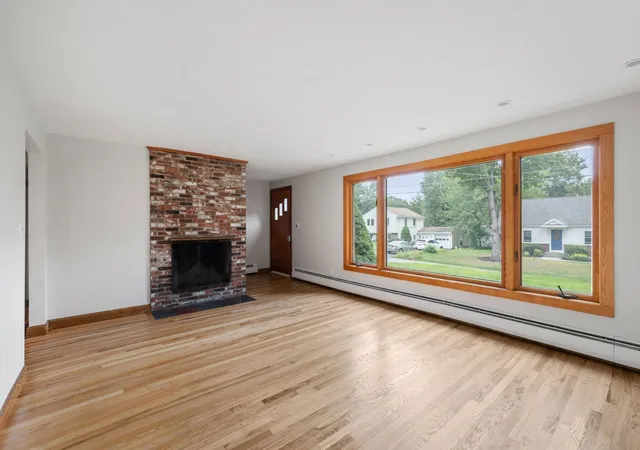


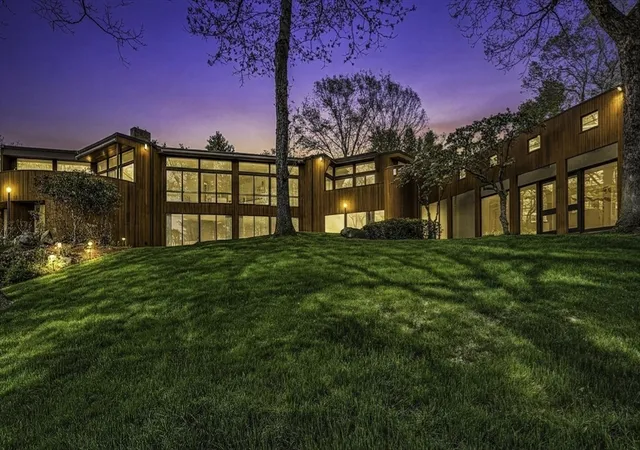
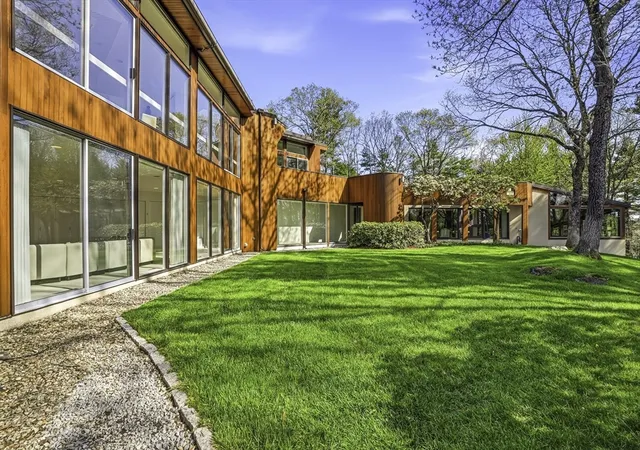
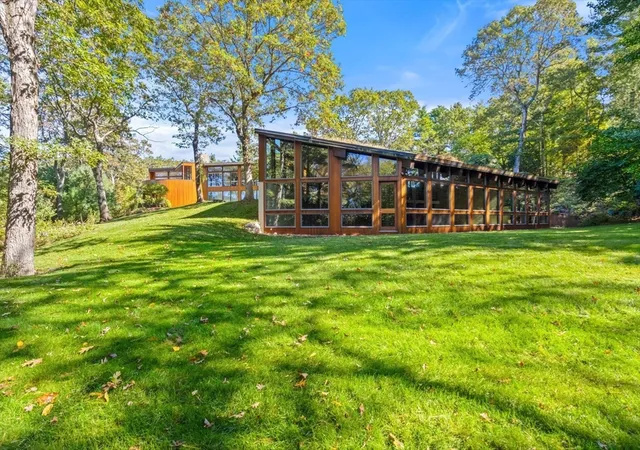
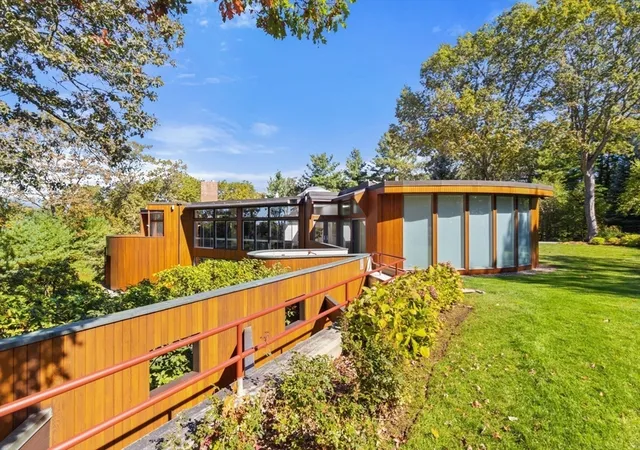
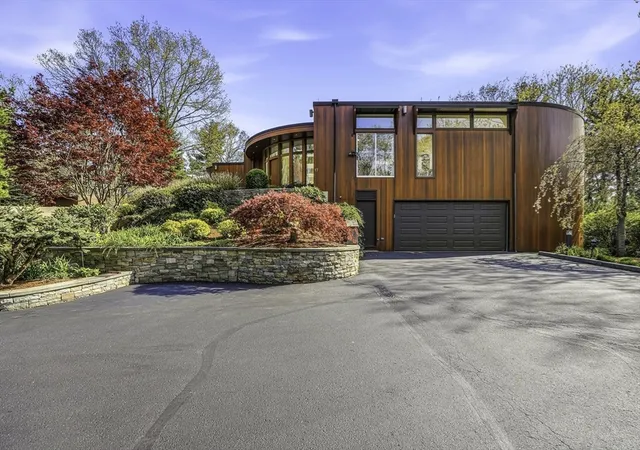

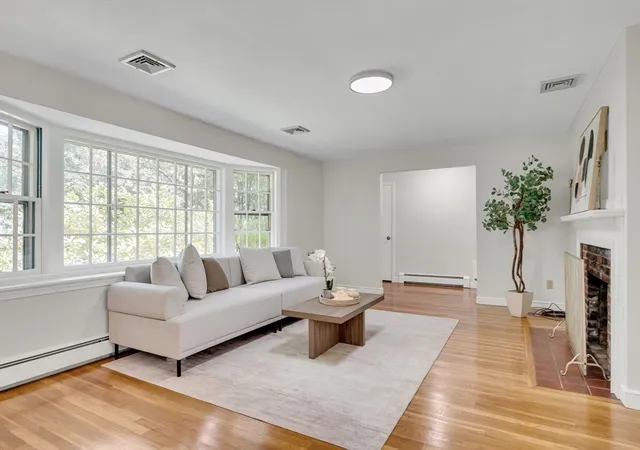
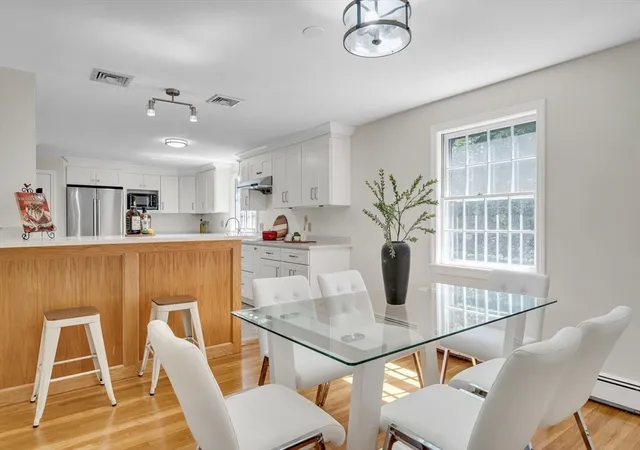
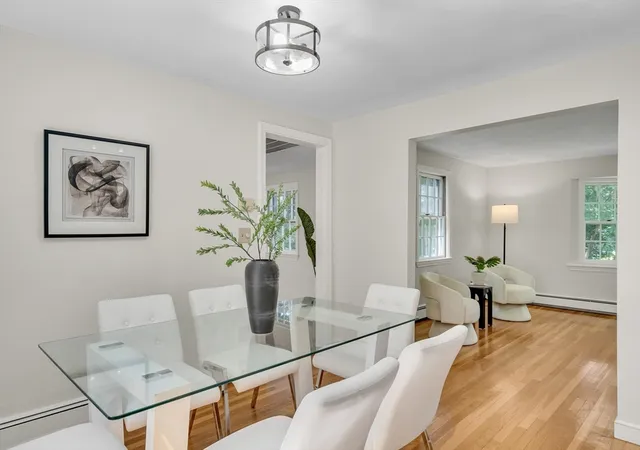
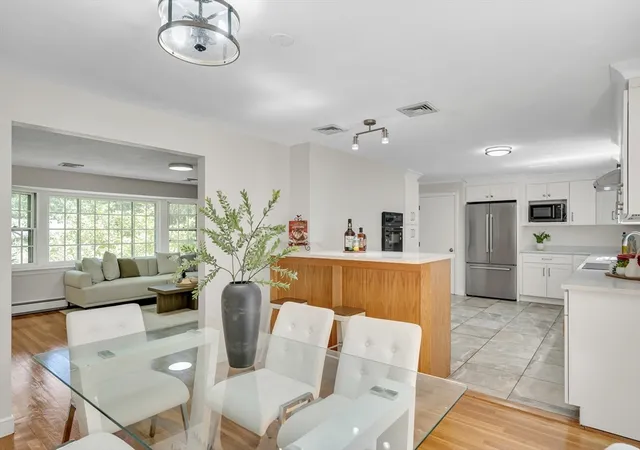
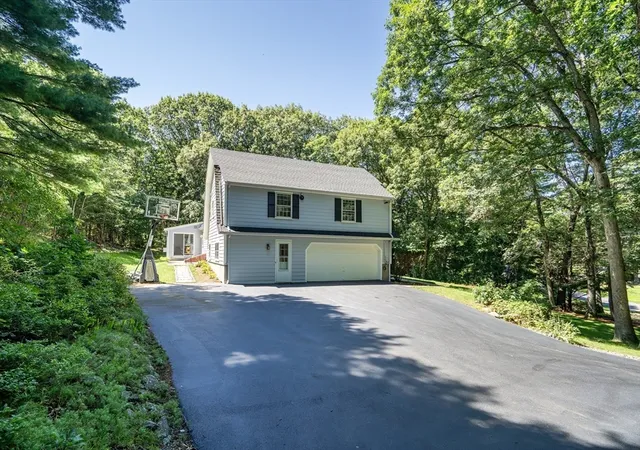
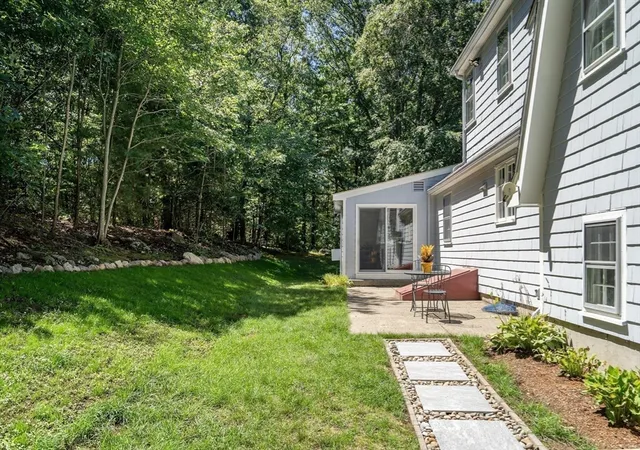
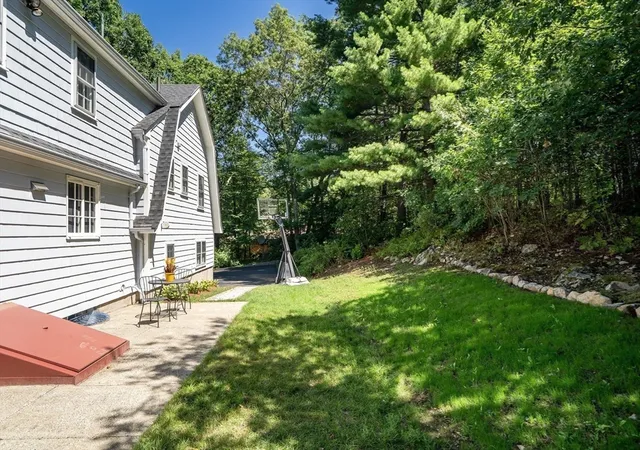
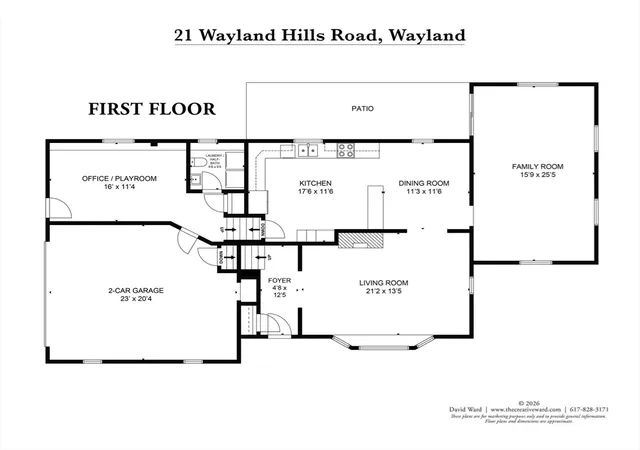
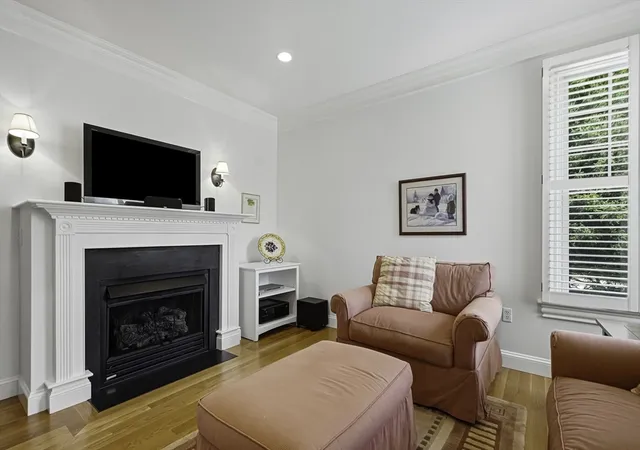
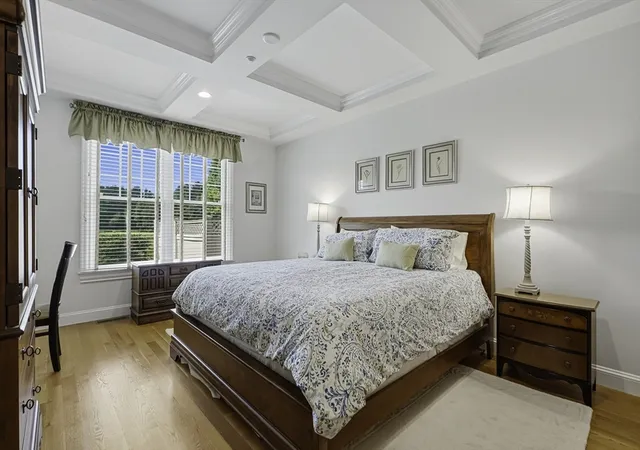
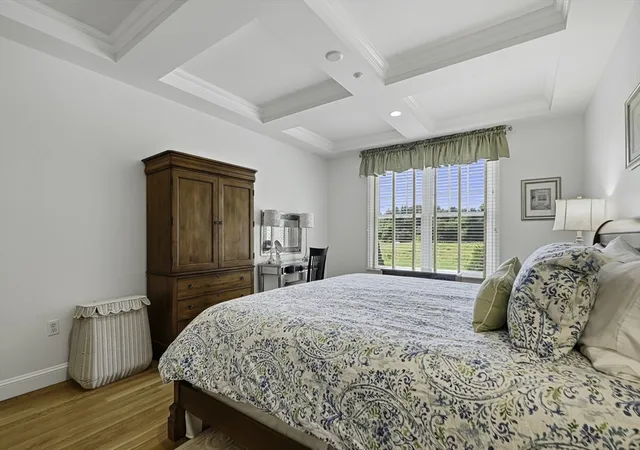
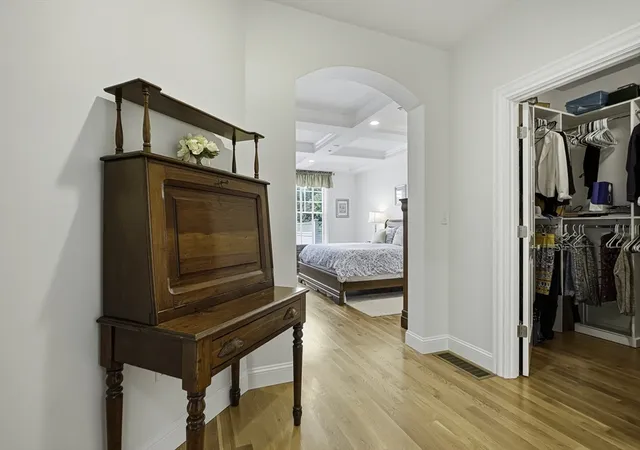
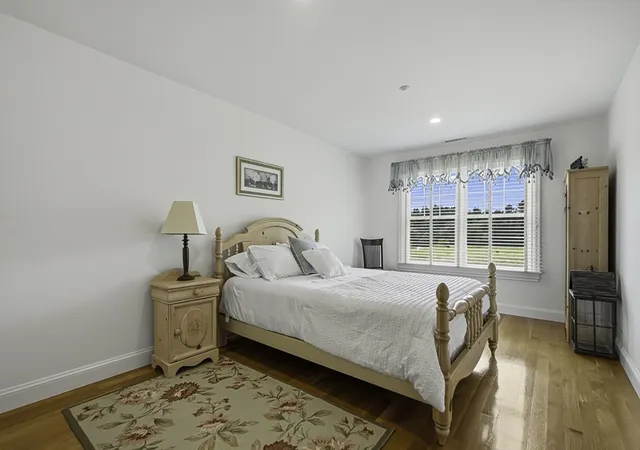
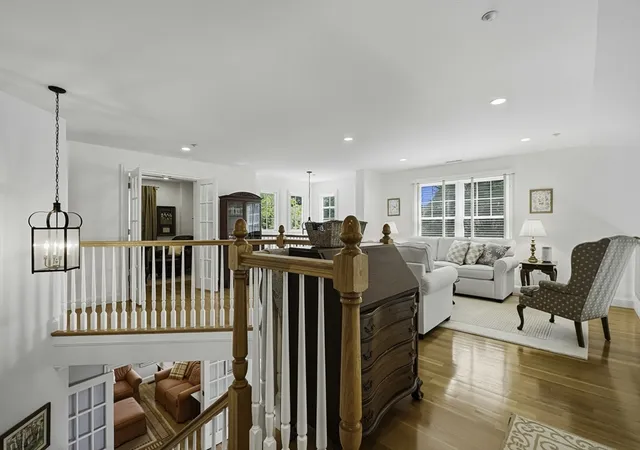
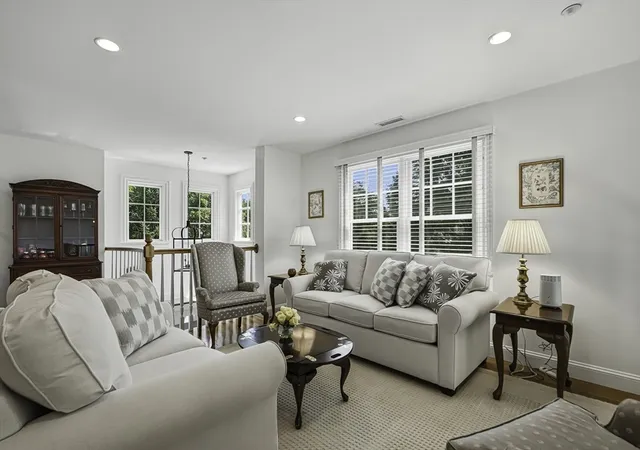
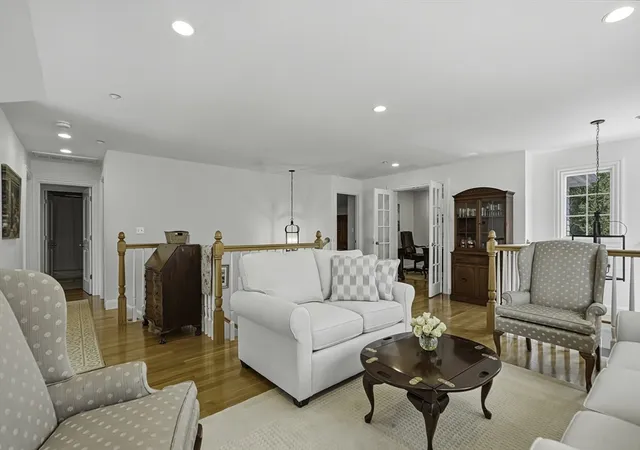
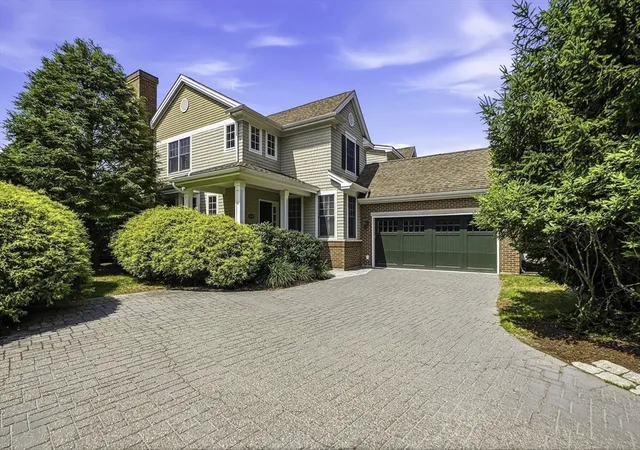
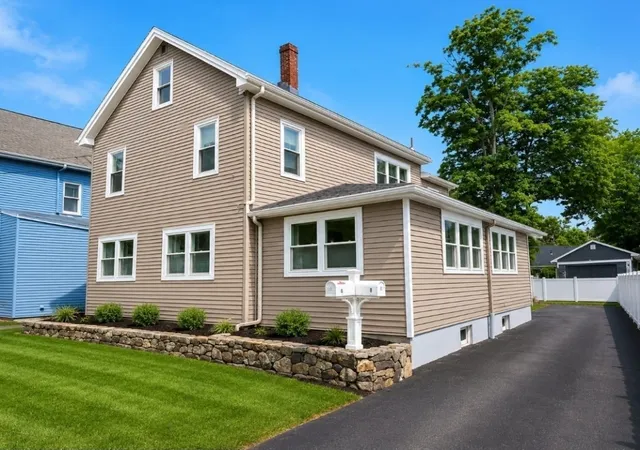
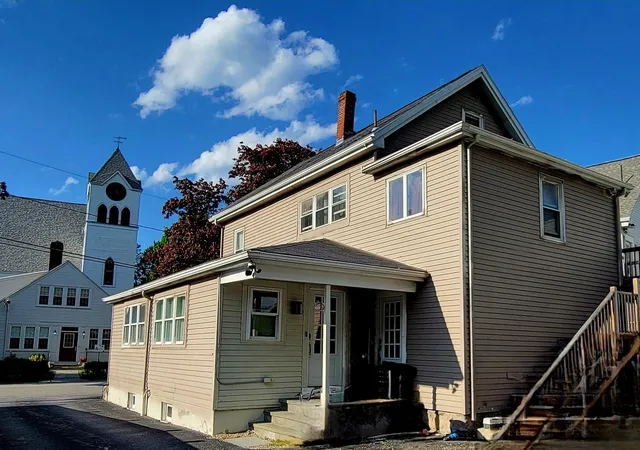

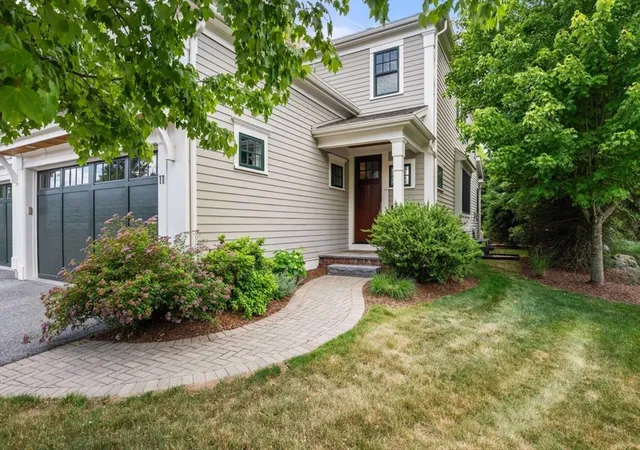
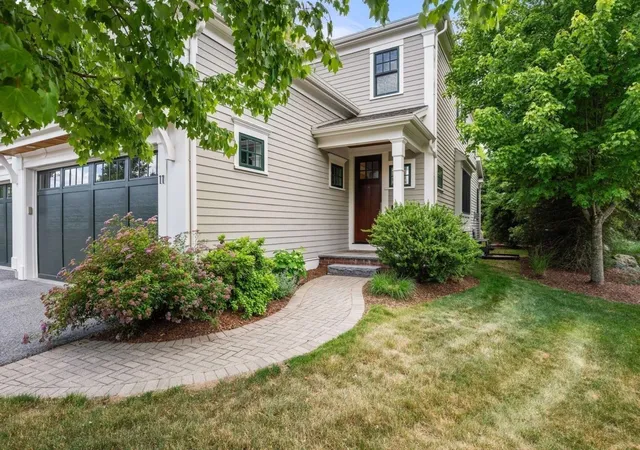
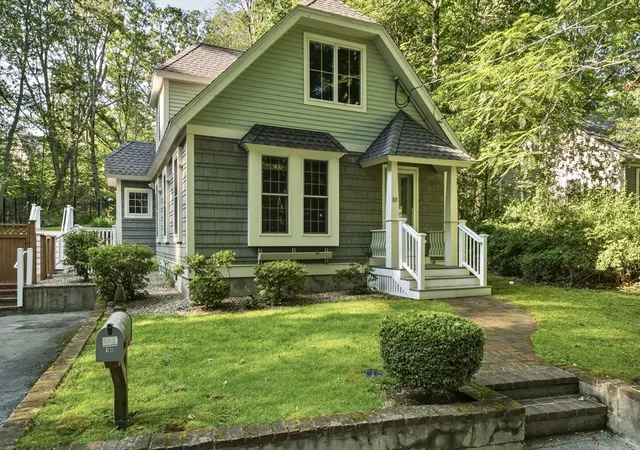
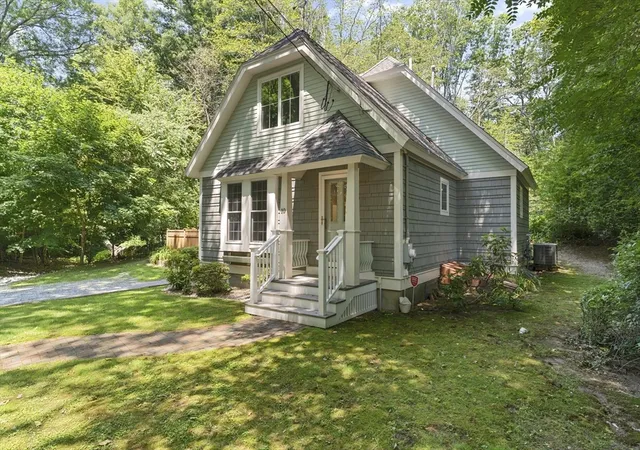
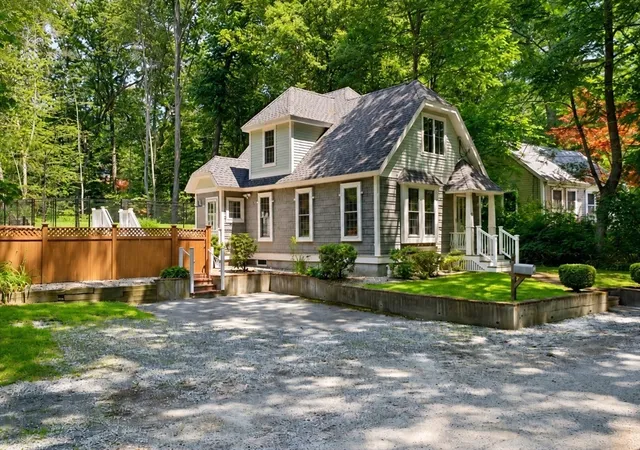
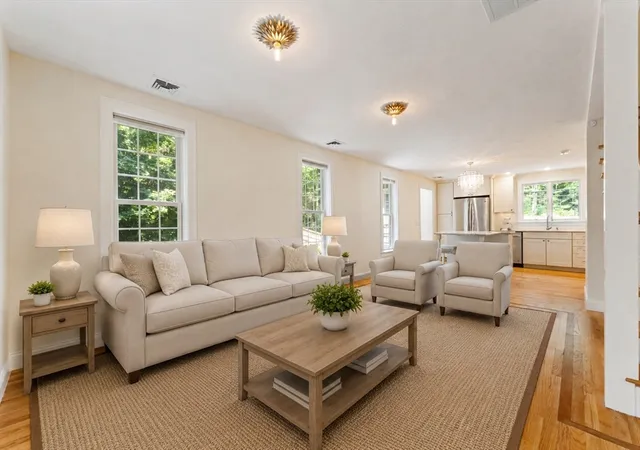
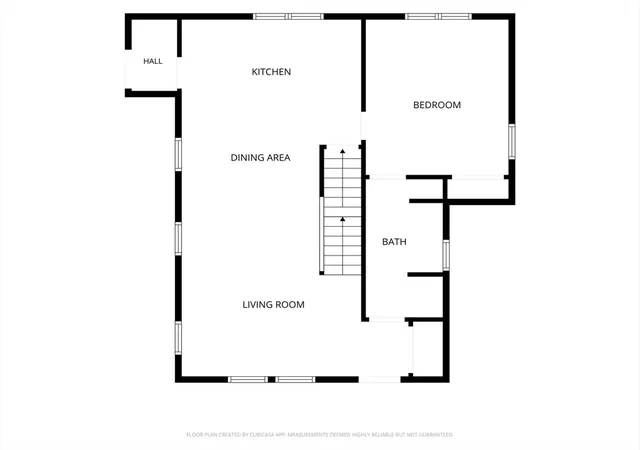
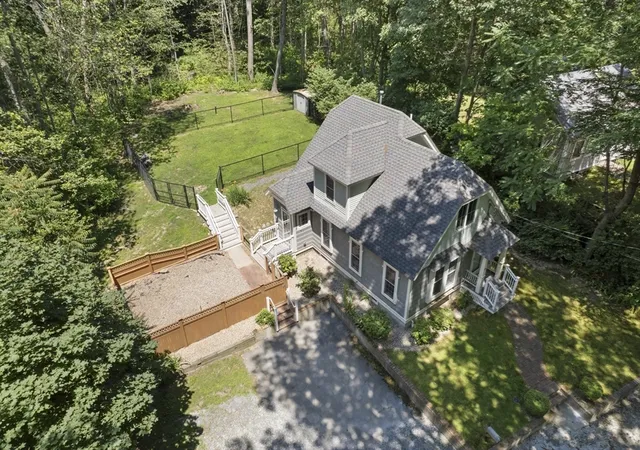
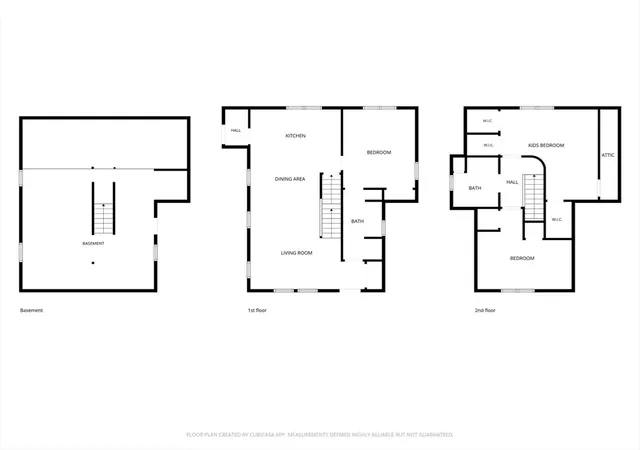
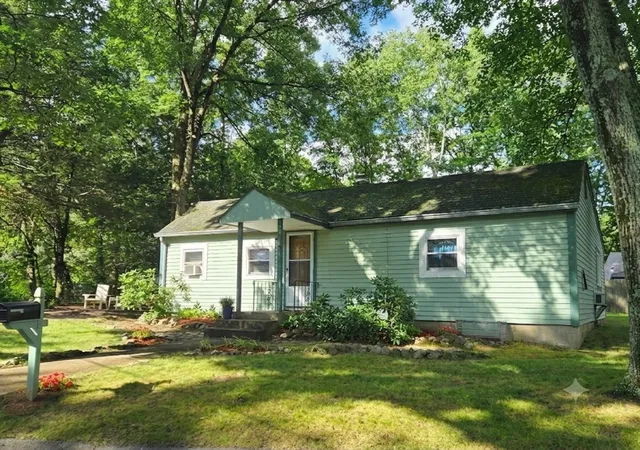
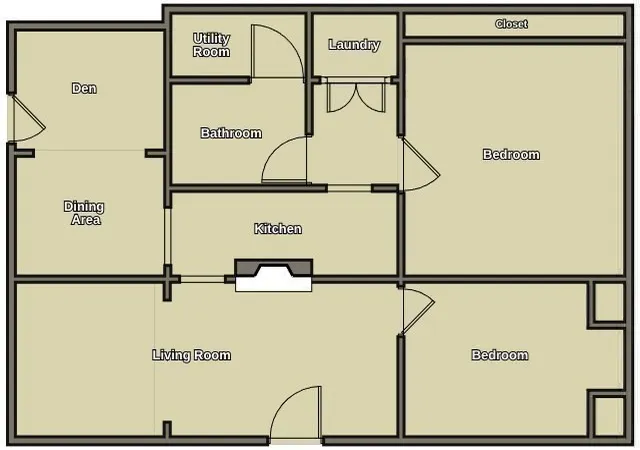
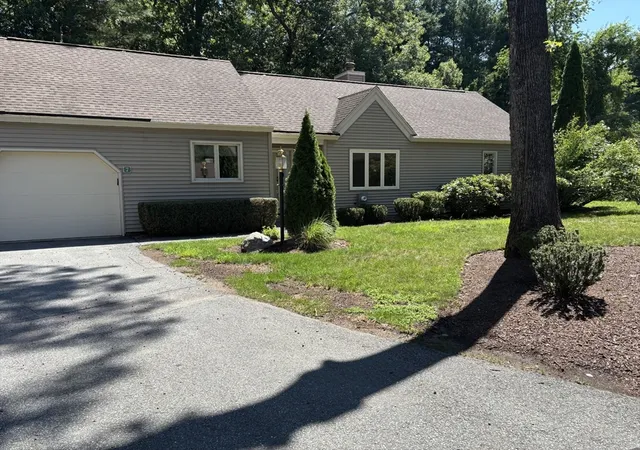

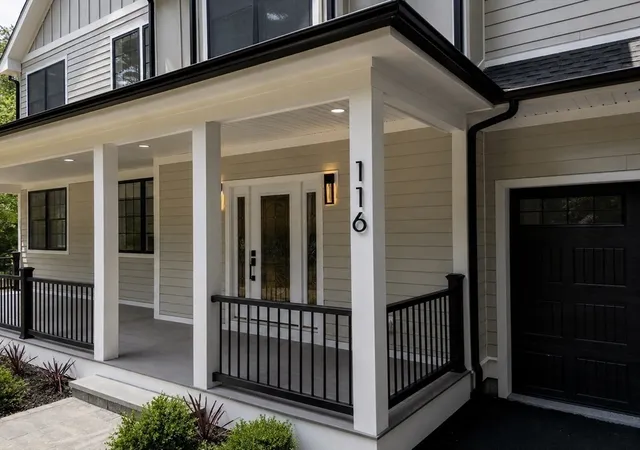


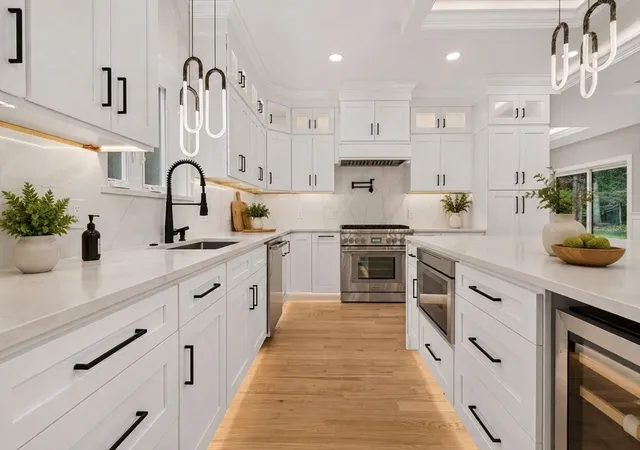
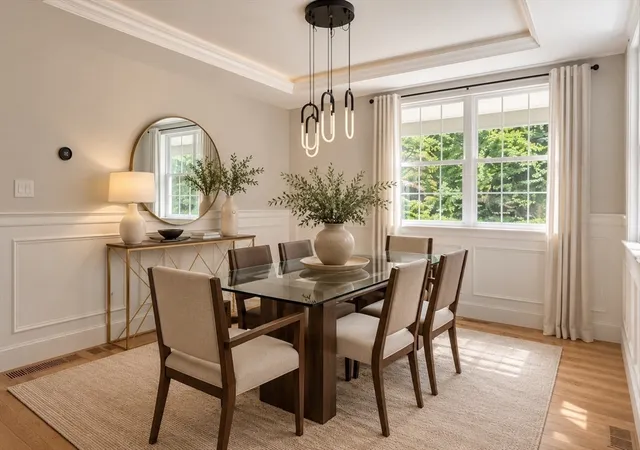


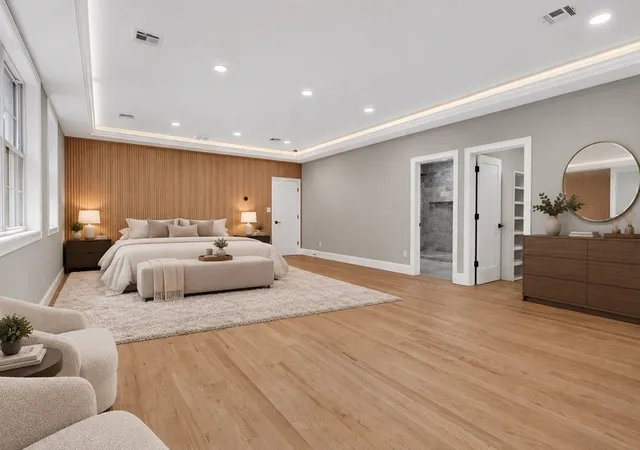


Top 3 Safest Places to Live for Retirees in Massachusetts
Top 3 Safest Places to Live in Massachusetts for Families
Top 3 Safest Places to Live in Massachusetts for Young Adults

 Download the App Now!
4.8-star mobile app
Browse 1.6 million listings
Get instant alerts for new homes
List homes on the go
Manage showings and submit offers


Frequently Asked Questions
Is Massachusetts a safe state?

What is the safest city in Massachusetts?
Is Massachusetts a good place to retire?
How to buy a house in Massachusetts in a safe area?
Which cities are considered the cheapest in Massachusetts?

Important Legal Disclosures
MLS Disclaimers
The market analysis provided on this page is for informational purposes only and does not constitute financial, investment, or legal advice. Data is sourced from public records, industry reports, and third-party providers, and while Houzeo strives for accuracy, we make no guarantees regarding the completeness, accuracy, or timeliness of the information presented.
All estimates, projections, and historical data are based on statistical models and should not be relied upon as predictions of future market conditions. Past performance is not indicative of future results, and real estate market conditions may change due to various economic and regulatory factors. Users are responsible for conducting their own due diligence before making any real estate or financial decisions. Houzeo is not liable for any decisions or actions taken based on the information provided. Any unauthorized use, duplication, or distribution of the data may violate copyright laws and result in legal consequences. Certain information, tools and services on this page may be powered by third-party vendors. Houzeo does not control or guarantee the accuracy, reliability, or functionality of such third-party services.