Safest Places to Live in Michigan
Michigan has a violent crime rate of about 4.4 per 1,000 people. Nearly 48% of residents still report concerns about safety. Whether you are looking at suburban areas like Novi or urban centers like Detroit, safety remains an important factor. The same applies to established cities such as Grand Rapids and Ann Arbor. For homebuyers, choosing the right neighborhood often starts with understanding safety trends. If you want Great Lakes living with more peace of mind, start with Houzeo's list of the safest places to live in Michigan.


 Rankings
 Find Your Home
 For Retirees
 For Families
 For Young Adults
 FAQs
FAQsRankings: 10 Safest Places in Michigan

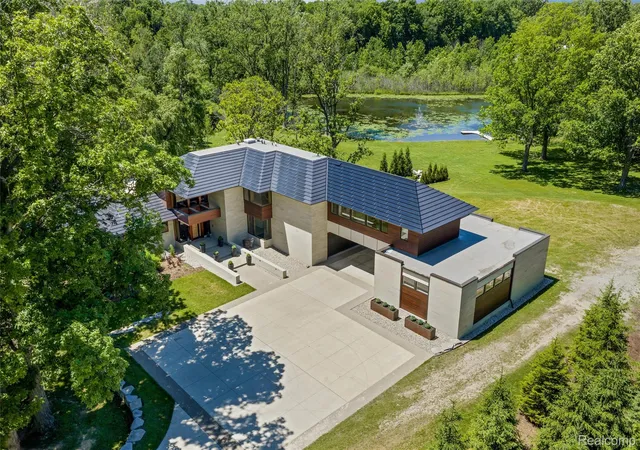
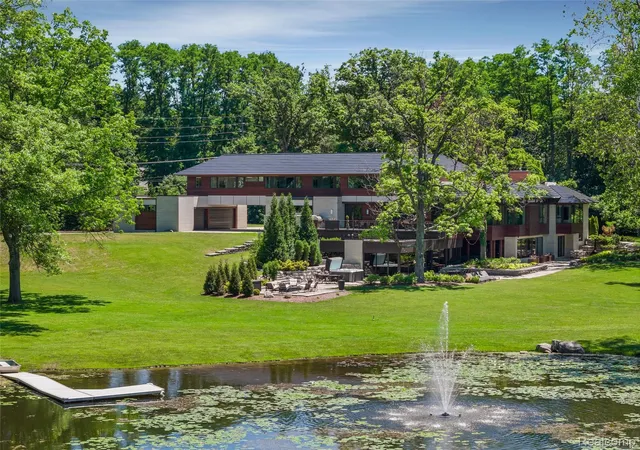
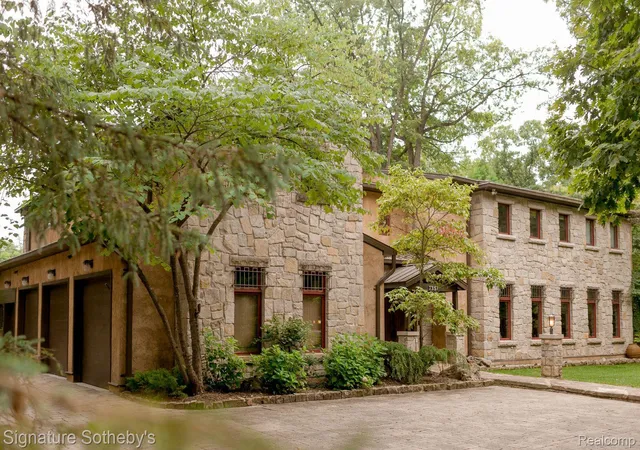
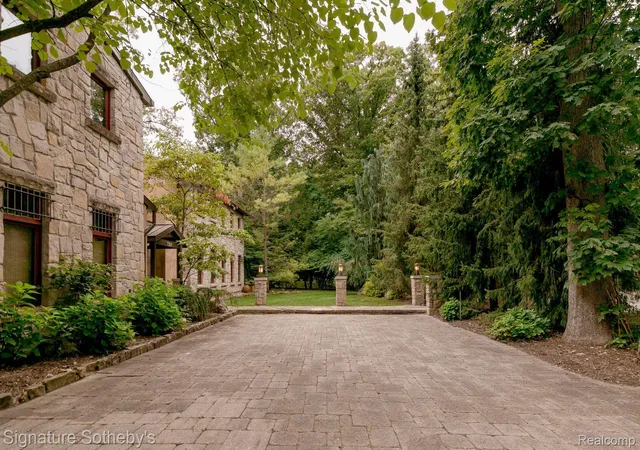
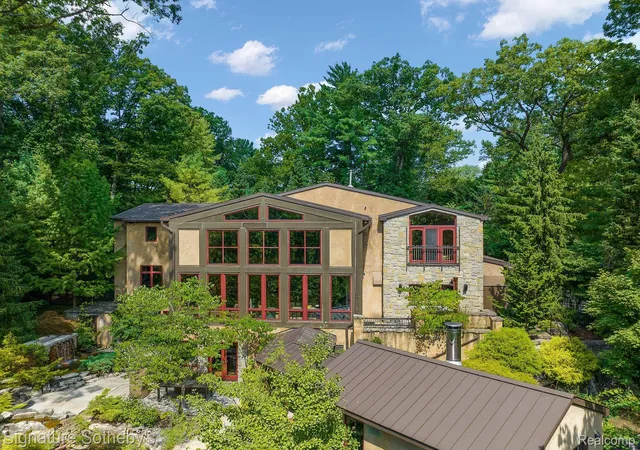
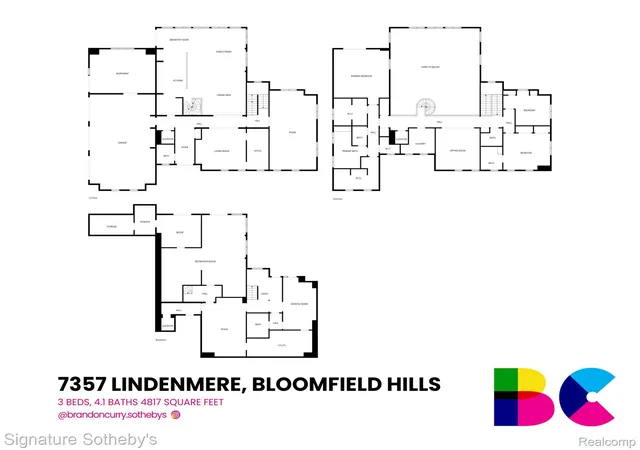
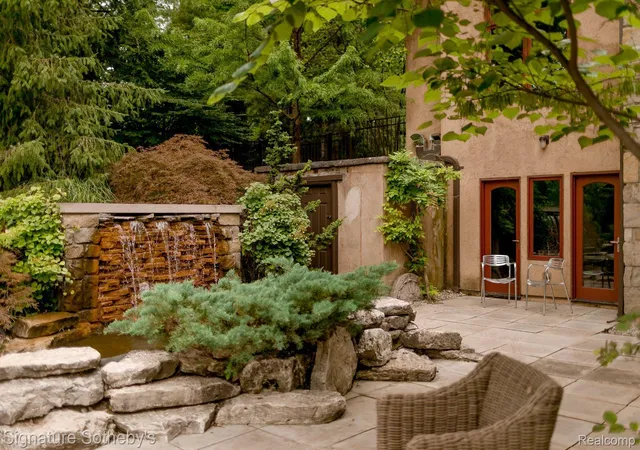
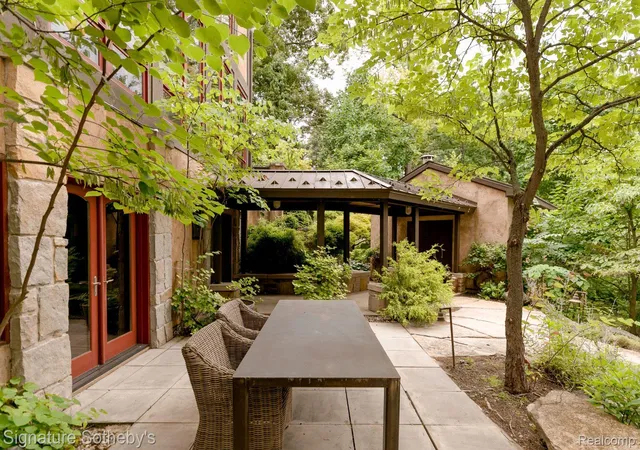
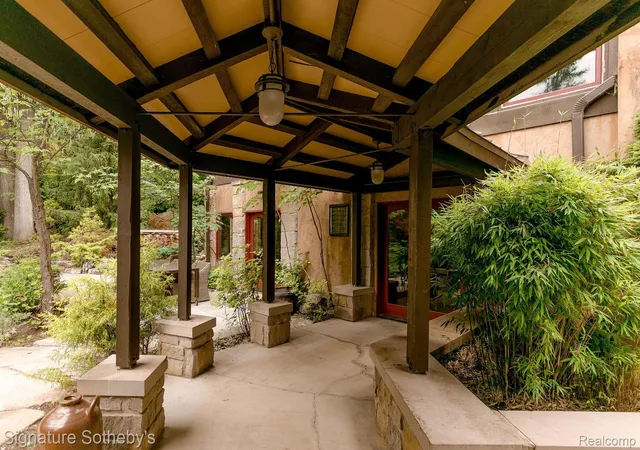
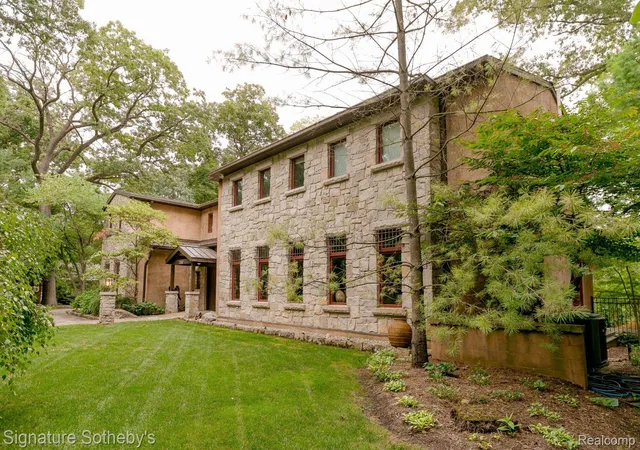
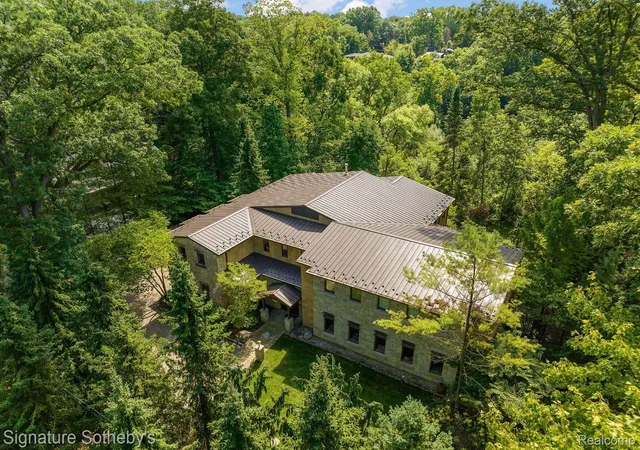
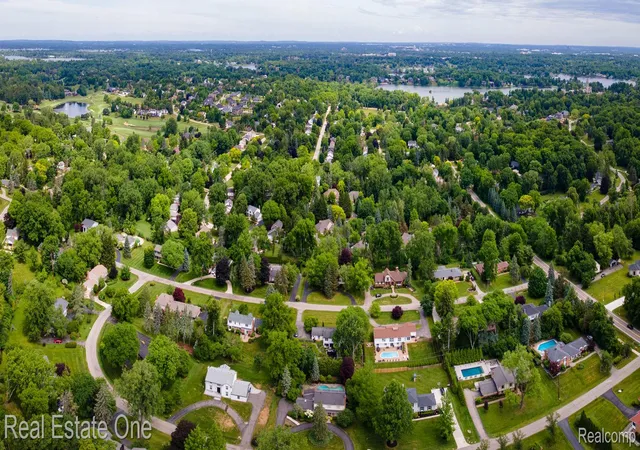
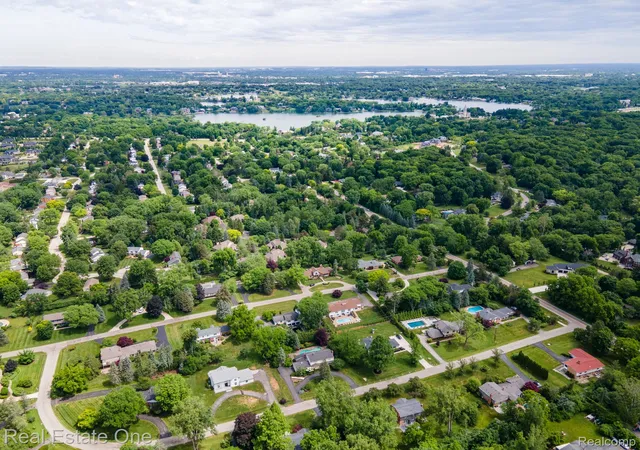
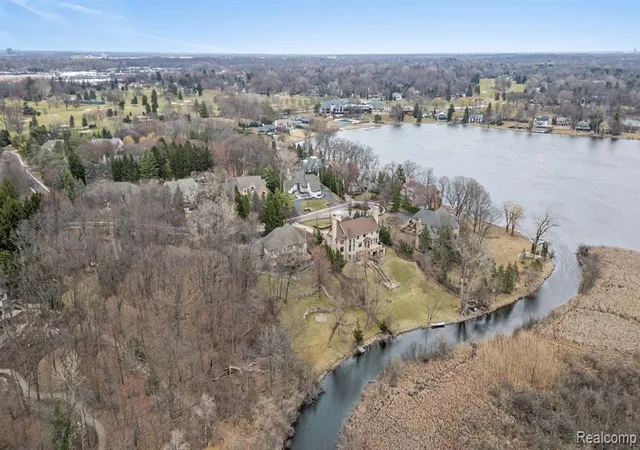
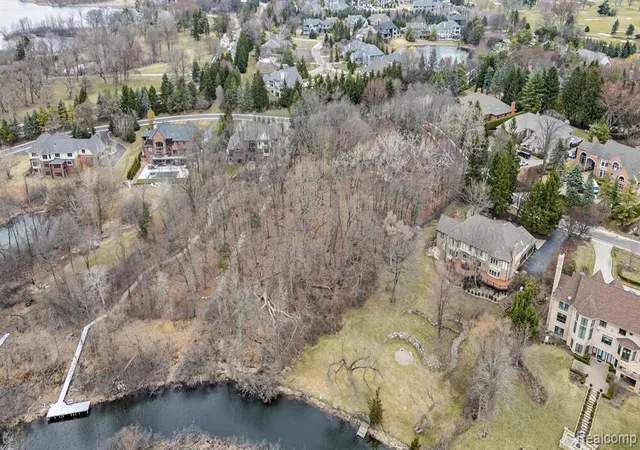
With below national level crime rates, Bloomfield Hills is one of the safest cities in Michigan. It has an extremely low violent crime at about 0.4 per 1,000 residents, with property crime near 8 per 1,000. Large estates, low density, and private security presence help maintain minimal crime across neighborhoods. Areas near Cranbrook and similar neighborhoods remain consistently stable with little to no crime. Bloomfield Hills is ideal for luxury buyers and retirees who prioritize privacy and exclusivity. However, high entry costs limit accessibility and reinforce its estate-style character.
With below national level crime rates, Bloomfield Hills is one of the safest cities in Michigan. It has an extremely low violent crime at about 0.4 per 1,000 residents, with property crime near 8 per 1,000. Large estates, low dens...

Personal Safety : 99


Property Safety : 83


Community Safety : 84
$2,725,000
Median Home Rent
$2,567

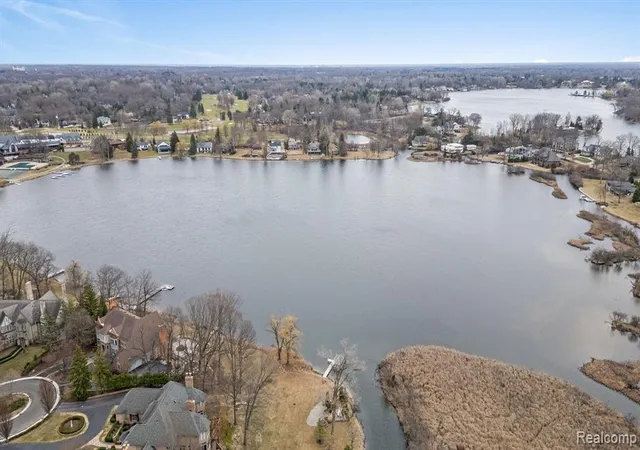
Beverly Hills is one of the Michigan's safest cities with crime levels below national averages. It sees about 0.7 violent crimes and 10 property crimes per 1,000 residents. Structured zoning, low density, and proactive village policing help maintain long-term safety. Tree-lined neighborhoods, especially near Beverly Park, remain consistently stable with minimal activities. Beverly Hills appeals to families seeking quiet suburban living, while limited housing supply keeps demand strong. Its location near Birmingham adds convenience without compromising its calm, residential character.
Beverly Hills is one of the Michigan's safest cities with crime levels below national averages. It sees about 0.7 violent crimes and 10 property crimes per 1,000 residents. Structured zoning, low density, and proactive village pol...
Personal Safety : 96
Property Safety : 76
Community Safety : 95
$635,000
Median Home Rent
$2,950

Rate Rochester Hills
4.0/5
1 Review

Job Market
100%

Commute
100%

Good Schools
100%

Affordability
100%

Public Transit
100%

Future Growth
100%
Rochester Hills is one of the best places to live in Michigan with well-planned neighborhoods, structured zoning, and active community oversight. Oakland County policing maintains consistent security citywide. Western areas near Adams Rd and newer subdivisions are more secure. But retail areas along M-59 may see minor theft. Higher home prices reflect steady demand and families benefit from top-rated Rochester schools. Rochester Hills offers suburban space, trails, parks, and long-term stability.
Rochester Hills is one of the best places to live in Michigan with well-planned neighborhoods, structured zoning, and active community oversight. Oakland County policing maintains consistent security citywide. Western areas near A...
Personal Safety : 90
Property Safety : 88
Community Safety : 89
$355,000
Median Home Rent
$2,250

Plymouth sees violent crimes and property crimes below U.S. averages. Walkable planning, active community presence, and well-maintained neighborhoods make it one of the safest places in Michigan. Residential streets remain the most secure, while downtown near Kellogg Park sees minor property crime due to activity. Plymouth is in high demand driven by its vibrant small-town atmosphere and frequent local events. The city attracts young professionals and families seeking a balanced lifestyle.
Plymouth sees violent crimes and property crimes below U.S. averages. Walkable planning, active community presence, and well-maintained neighborhoods make it one of the safest places in Michigan. Residential streets remain the mos...
Personal Safety : 91
Property Safety : 80
Community Safety : 86
$685,000
Median Home Rent
$1,699

Birmingham records about 1.0 violent crimes and 18 property crimes per 1,000 residents. The higher property crime rate is driven by dense retail along Woodward Ave. Strong policing keeps serious incidents low, even with heavy foot traffic. Residential streets remain quieter and well-managed, offering a clear contrast to busy commercial zones. Birmingham suits professionals and families seeking upscale and walkable living. Its high housing costs reflect its prime location and active downtown lifestyle.
Birmingham records about 1.0 violent crimes and 18 property crimes per 1,000 residents. The higher property crime rate is driven by dense retail along Woodward Ave. Strong policing keeps serious incidents low, even with heavy foot...
Personal Safety : 94
Property Safety : 76
Community Safety : 89
$1,140,000
Median Home Rent
$2,850

Novi is one of the safer big cities in Michigan. It maintains consistent stability due to controlled growth, modern infrastructure, and active policing. Planned communities and newer developments report the lowest crime levels. But high-traffic commercial areas and areas near Twelve Oaks Mall may see more incidents. Novi appeals to families and remote workers seeking newer housing, strong schools, and modern amenities.
Novi is one of the safer big cities in Michigan. It maintains consistent stability due to controlled growth, modern infrastructure, and active policing. Planned communities and newer developments report the lowest crime levels. Bu...
Personal Safety : 89
Property Safety : 89
Community Safety : 80
$387,500
Median Home Rent
$1,950

Northville reports very low violent crime at about 0.5 per 1,000 residents, with property crime near 9 per 1,000, well below national norms. It is one of the safest cities in Michigan with a walkable downtown, low density, and strong civic engagement. Both historic districts and newer township neighborhoods perform well with little to no crime. Limited inventory keeps competition high, while the city stands out for its charm, local shops, and strong identity. Northville's stable environment and strong community feel benefits families and retirees the most.
Northville reports very low violent crime at about 0.5 per 1,000 residents, with property crime near 9 per 1,000, well below national norms. It is one of the safest cities in Michigan with a walkable downtown, low density, and str...
Personal Safety : 86
Property Safety : 73
Community Safety : 69
$487,000
Median Home Rent
$2,350

Rate Troy
3.0/5
1 Review
Job Market
100%
Commute
100%
Good Schools
100%
Affordability
100%
Public Transit
100%
Future Growth
100%
Troy reports about 1.2 violent crimes and 13 property crimes per 1,000 residents, both below national averages. As one of the biggest cities in Michigan, it has a busy commercial landscape. Active policing and strong infrastructure keep residential areas stable and secure. The city separates residential zones from retail corridors like Big Beaver Rd, maintaining consistent safety. While property crime is slightly higher near hubs like Somerset Collection, overall safety remains strong. Troy offers diverse housing and easy access to major business districts, making it ideal for professionals.
Troy reports about 1.2 violent crimes and 13 property crimes per 1,000 residents, both below national averages. As one of the biggest cities in Michigan, it has a busy commercial landscape. Active policing and strong infrastructur...
Personal Safety : 86
Property Safety : 77
Community Safety : 82
$465,000
Median Home Rent
$2,300

Farmington Hills maintains violent crime around 1.1 per 1,000 residents, with property crime near 14 per 1,000, both below national levels. Large lot sizes, low-density planning, and consistent local investment help reduce risk across neighborhoods. Western areas near Drake Rd and established subdivisions tend to be the most stable. Property crime can rise slightly near busier roads like Grand River Ave. Families benefit from strong schools and parks, while buyers gain access to suburban space and long-term consistency in Farmington Hills.
Farmington Hills maintains violent crime around 1.1 per 1,000 residents, with property crime near 14 per 1,000, both below national levels. Large lot sizes, low-density planning, and consistent local investment help reduce risk ac...
Personal Safety : 86
Property Safety : 76
Community Safety : 73
$342,500
Median Home Rent
$1,689

Grosse Pointe Woods reports about 0.6 violent crimes and 9 property crimes per 1,000 residents, both below national averages. It is one of the best cities to live in Michigan for safety-conscious buyers. A strong sense of community and local policing helps keep neighborhoods stable over time. Interior residential streets, especially away from Mack Ave, are the most secure. Areas near commercial edges may see slightly elevated levels of crime. Families benefit from a close-knit community and lake access, while buyers are drawn to its established suburb feel and proximity to Detroit.
Grosse Pointe Woods reports about 0.6 violent crimes and 9 property crimes per 1,000 residents, both below national averages. It is one of the best cities to live in Michigan for safety-conscious buyers. A strong sense of communit...
Personal Safety : 90
Property Safety : 36
Community Safety : 85
Median Home Rent
$1,800
Transparent & data-driven
How We Ranked the Safest Cities
Each city is scored against the national average across three weighted categories, built entirely from FBI NIBRS crime data spanning 18 offense categories. Every metric is converted to a per-capita rate and a common 0–100 scale, so no single offense can dominate — and a city served by a non-reporting agency is never treated as crime-free.
Scoring weights
- Personal Safety50%
Homicide, rape, robbery, aggravated assault, kidnapping & human trafficking vs. the national rate.
- Property Security30%
Burglary, larceny, motor vehicle theft, arson & theft from buildings or vehicles vs. the national rate.
- Community Order20%
Simple assault, sex offenses, stolen property, vandalism, weapon & drug violations — the tiebreaker.
Our data source
Recalculated as each new annual NIBRS reporting year is released · agency-to-city mappings refresh quarterly.
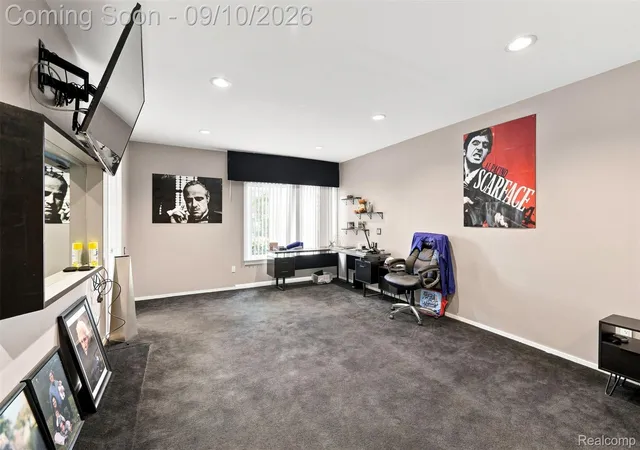
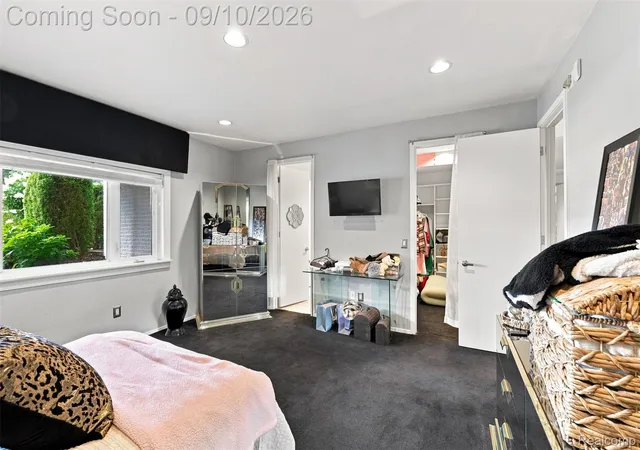
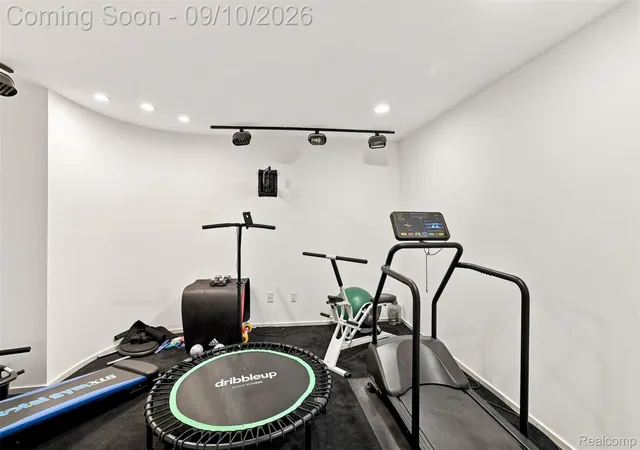
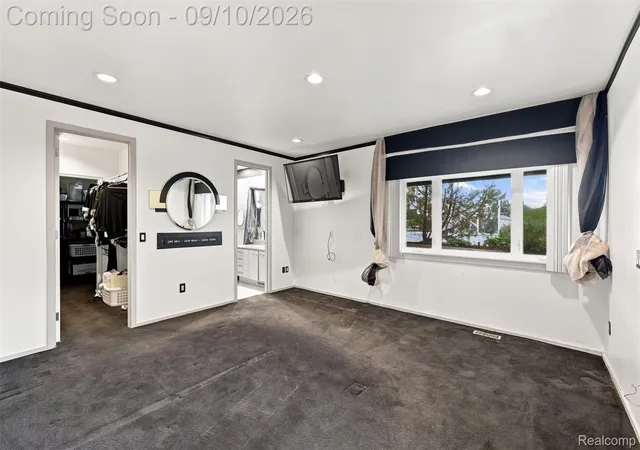
Your New Home is Waiting for You in Michigan
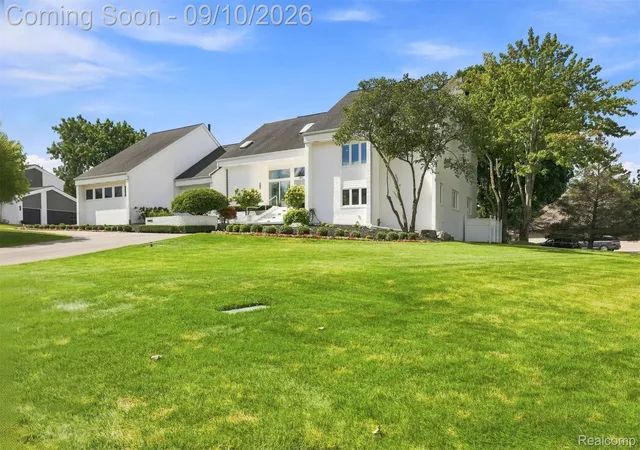
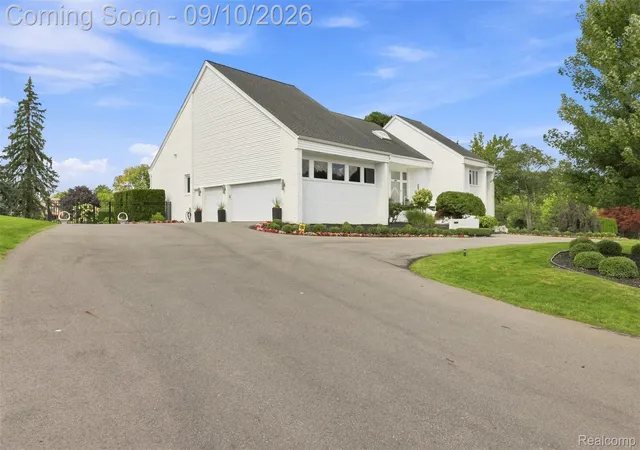
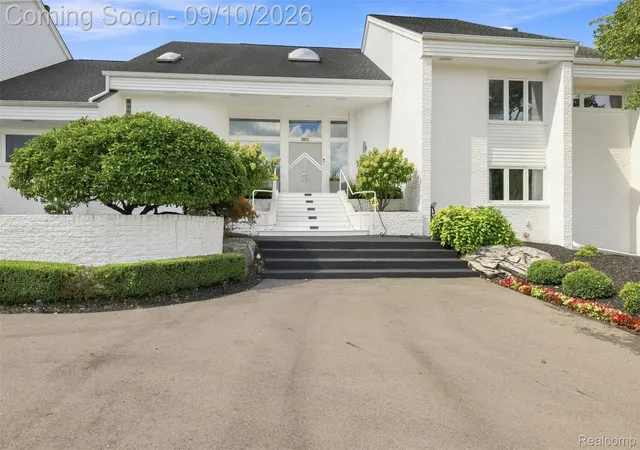
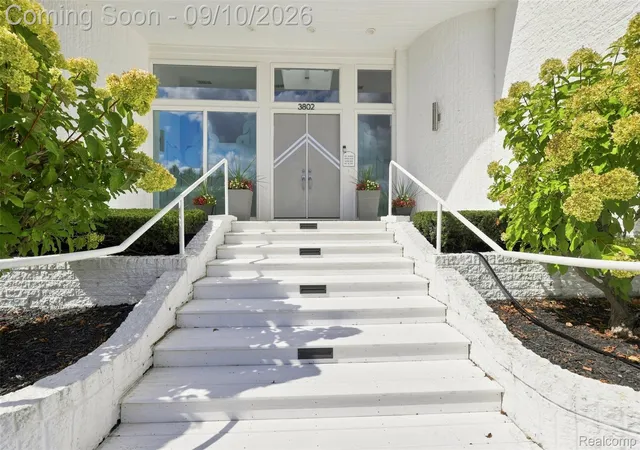
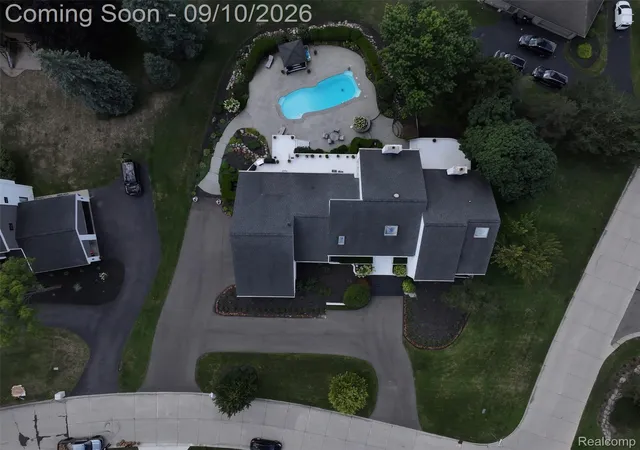
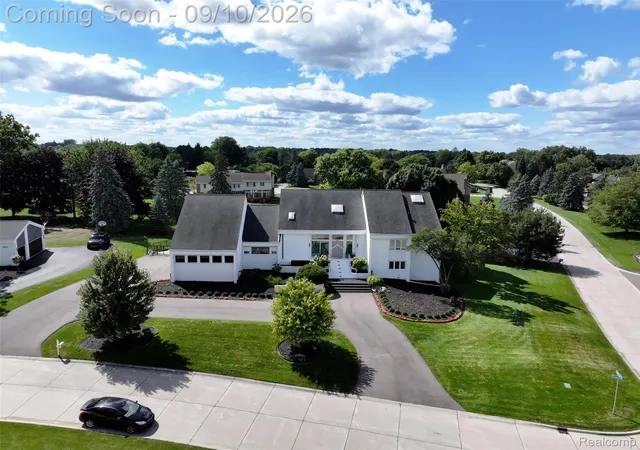
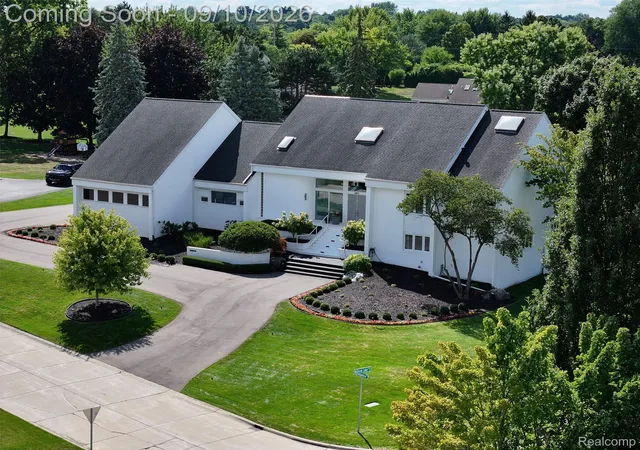
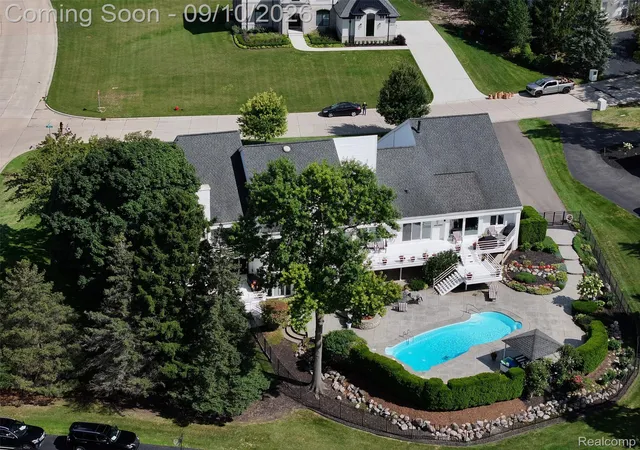
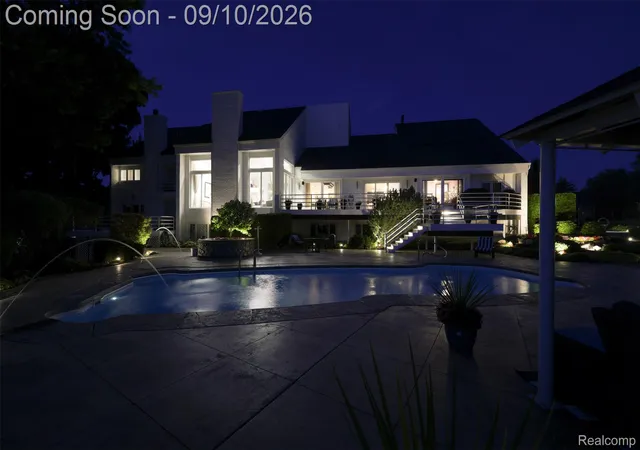
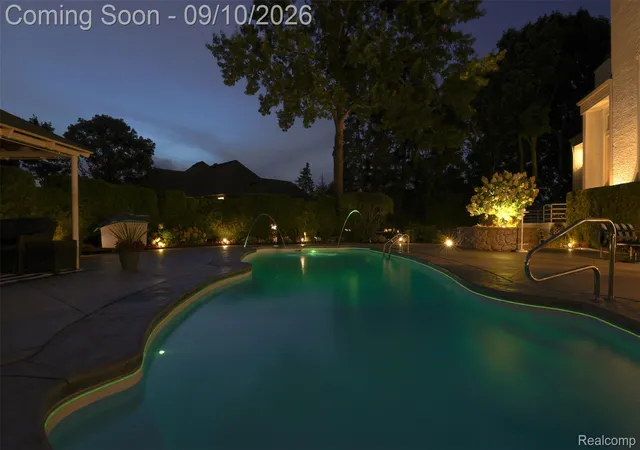
 9
9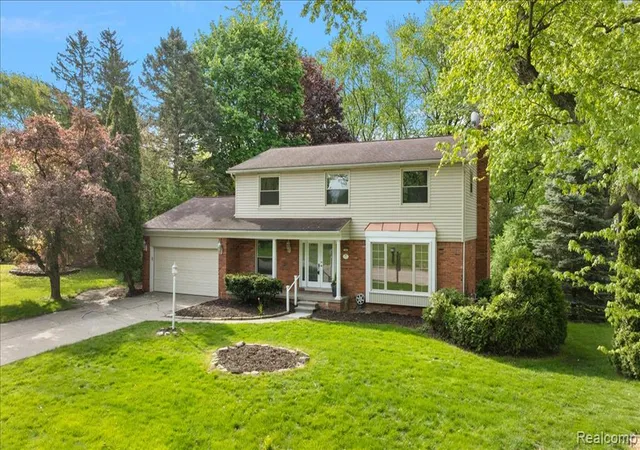
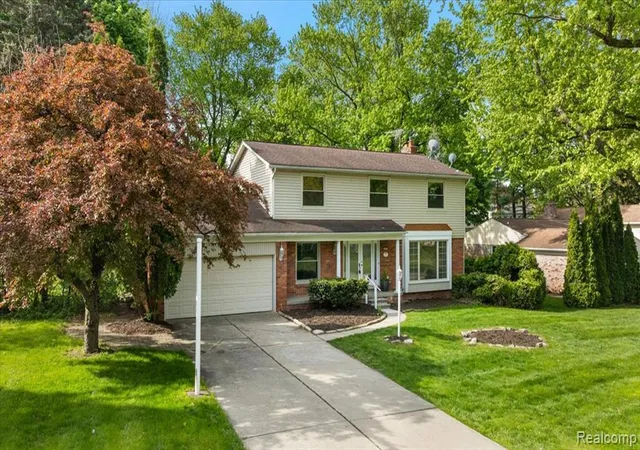
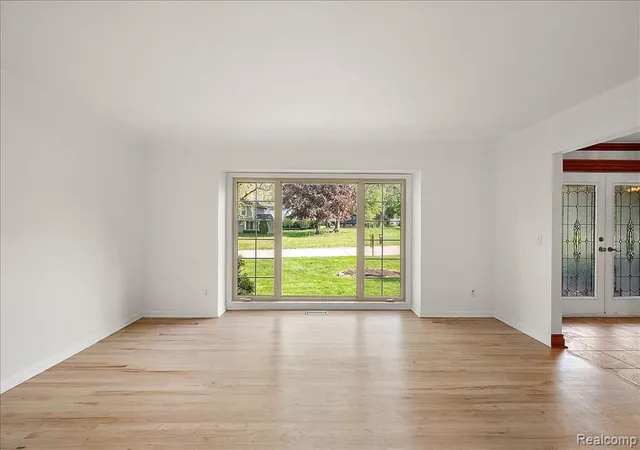
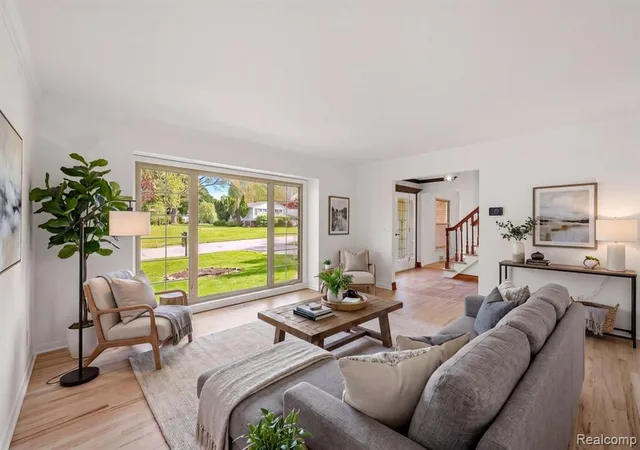
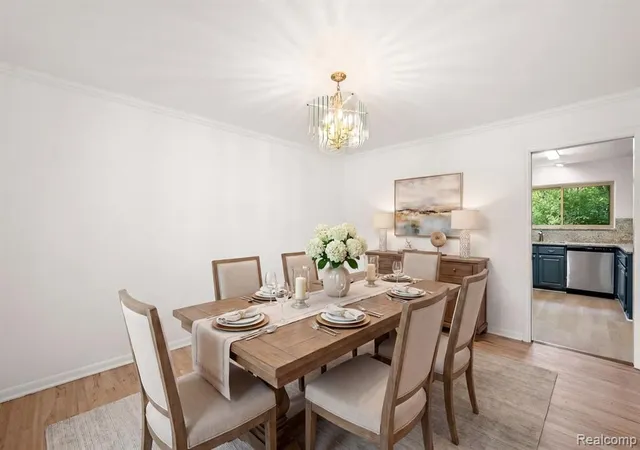
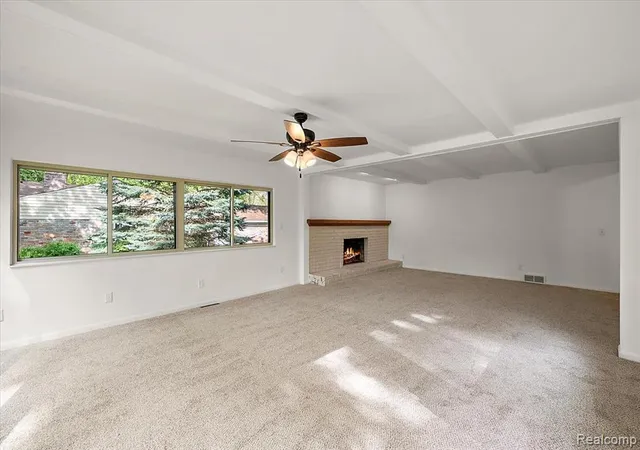
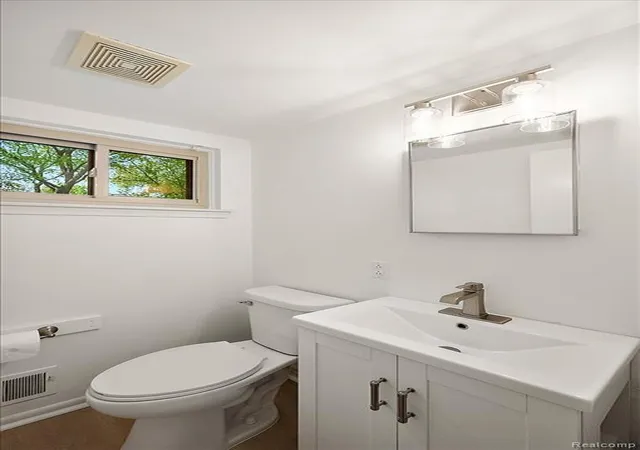
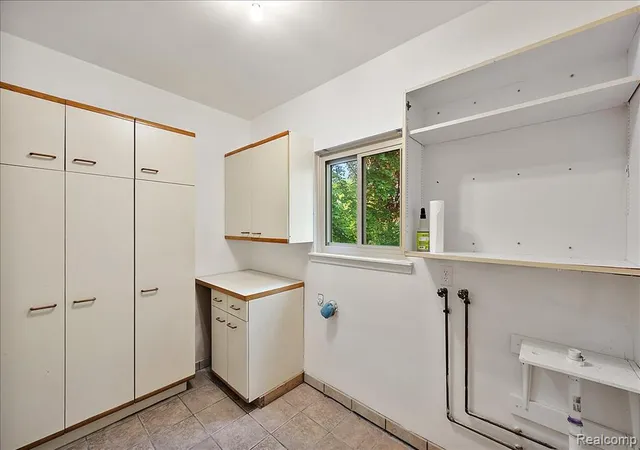
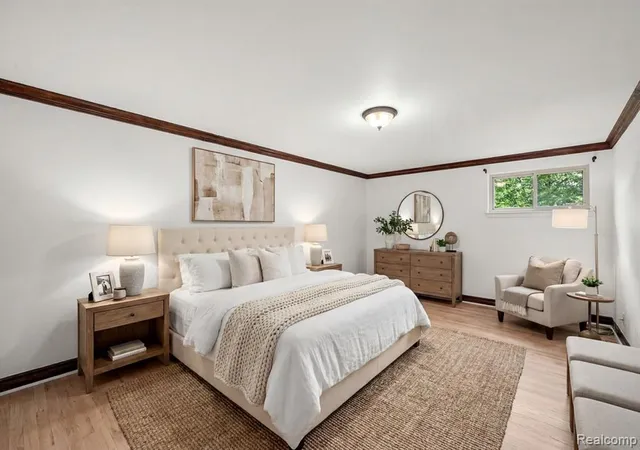
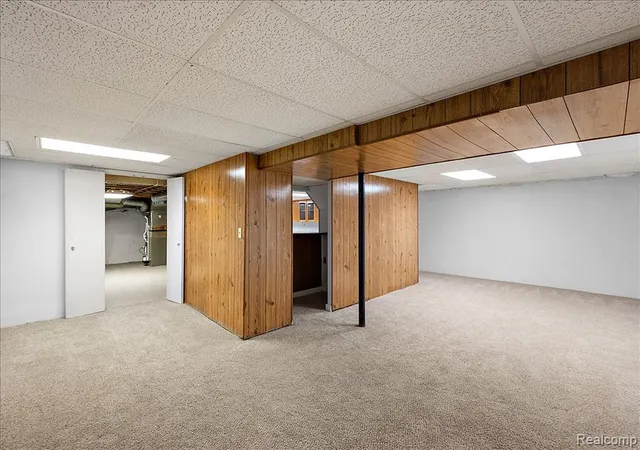
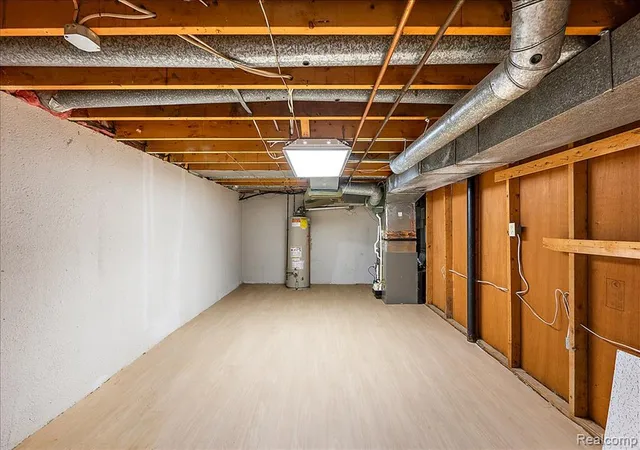
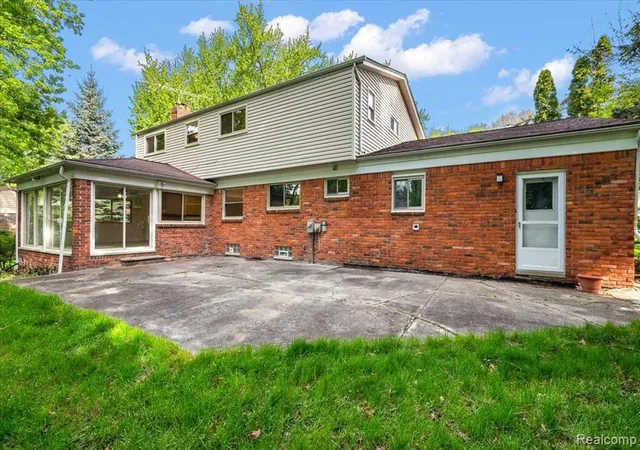
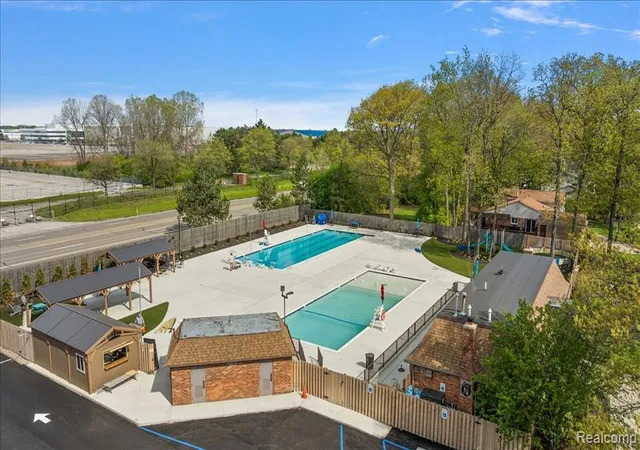

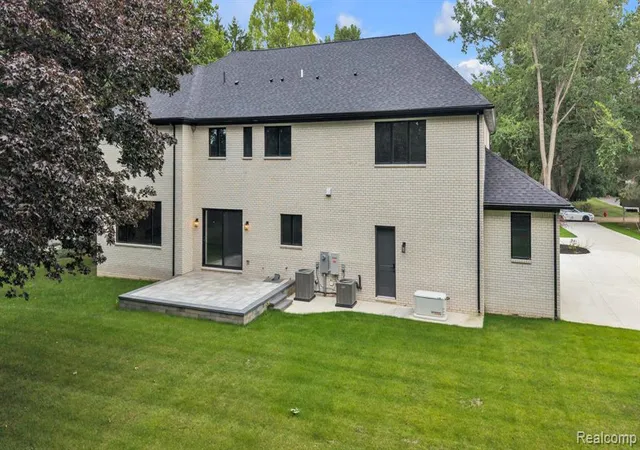
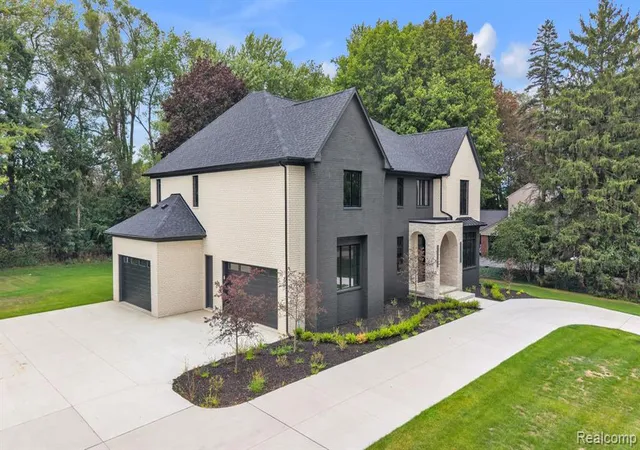
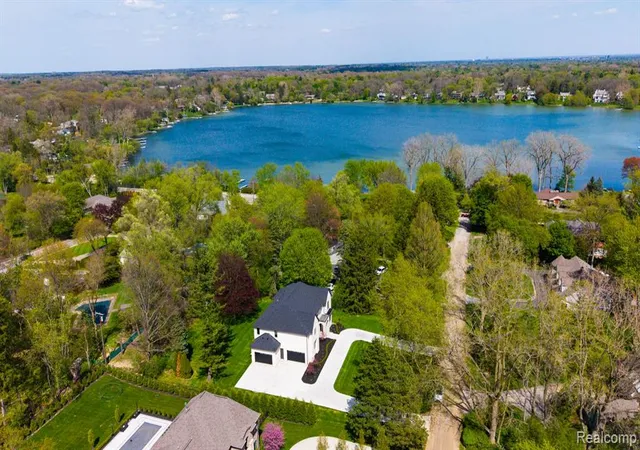
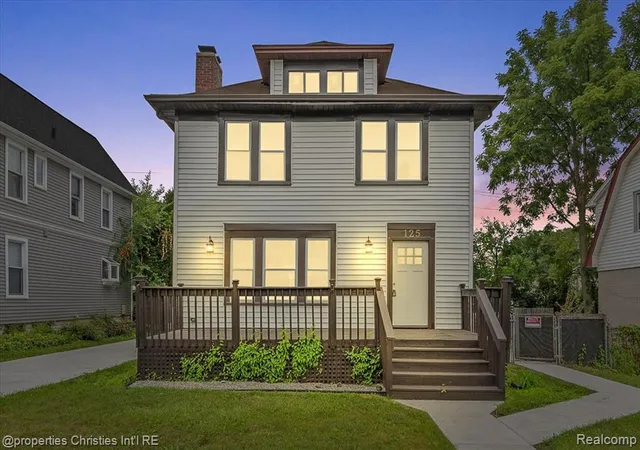
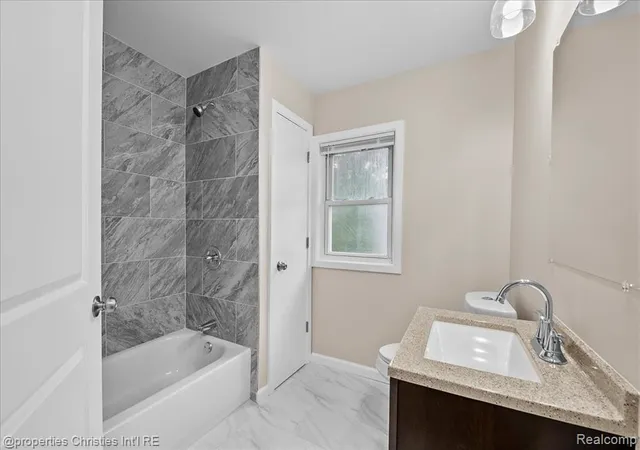



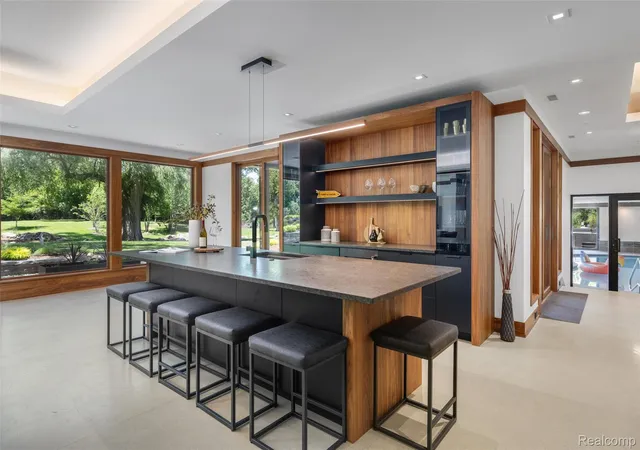
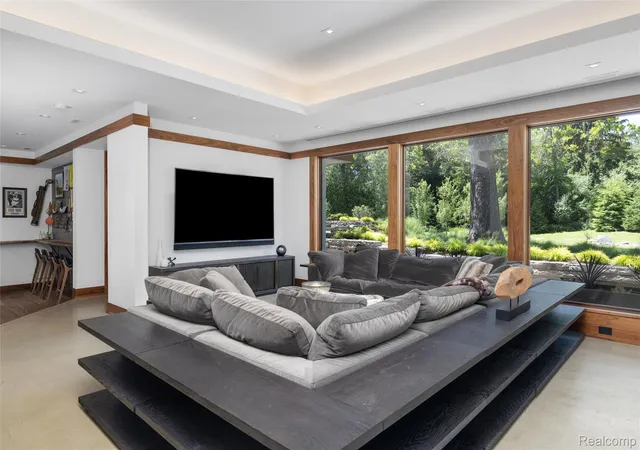
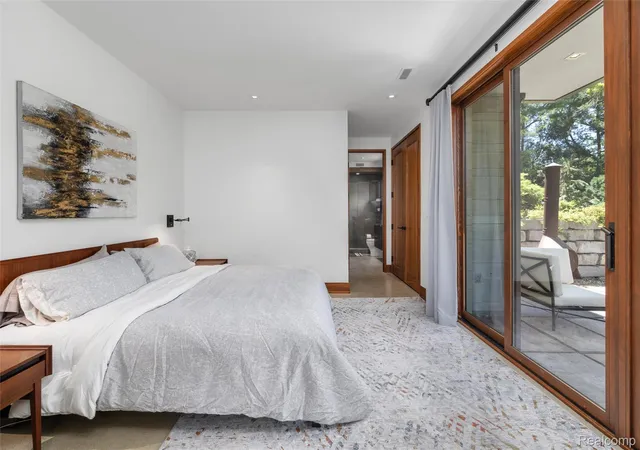
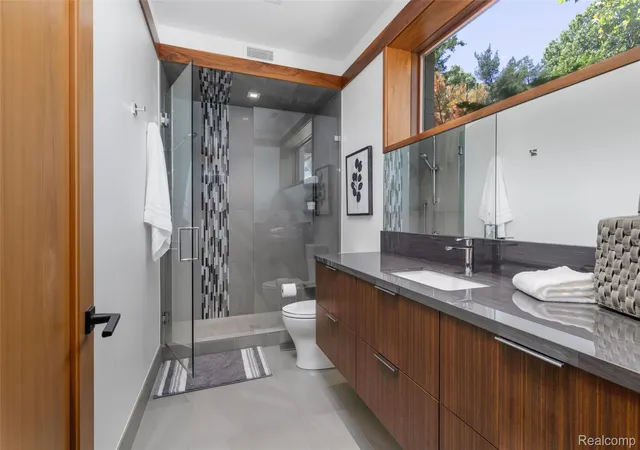
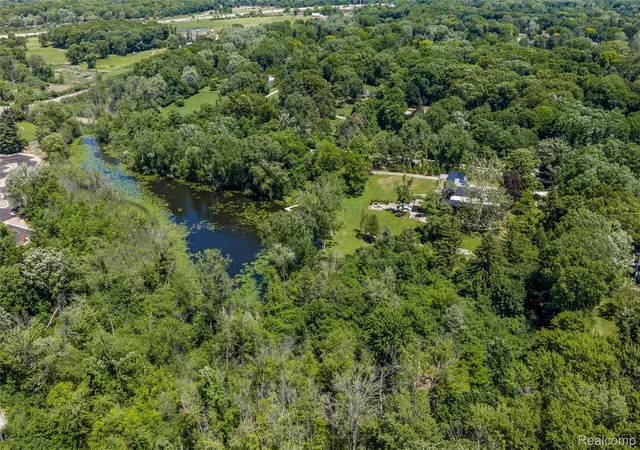
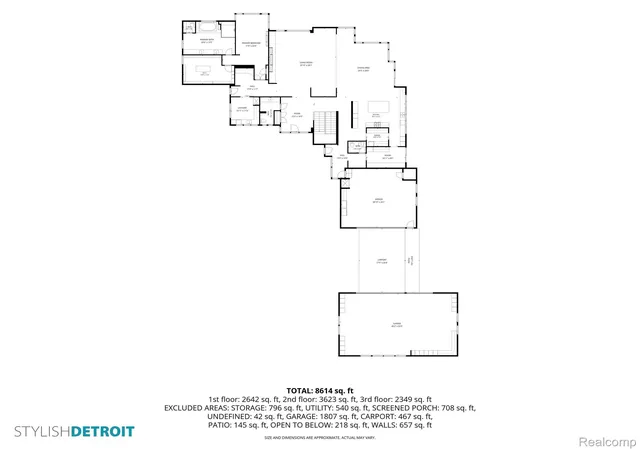
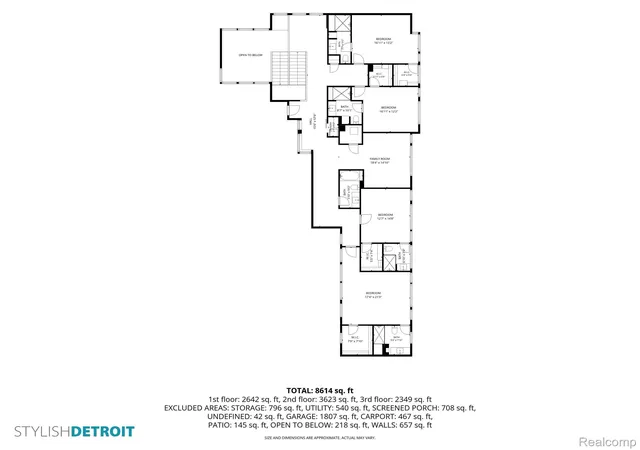
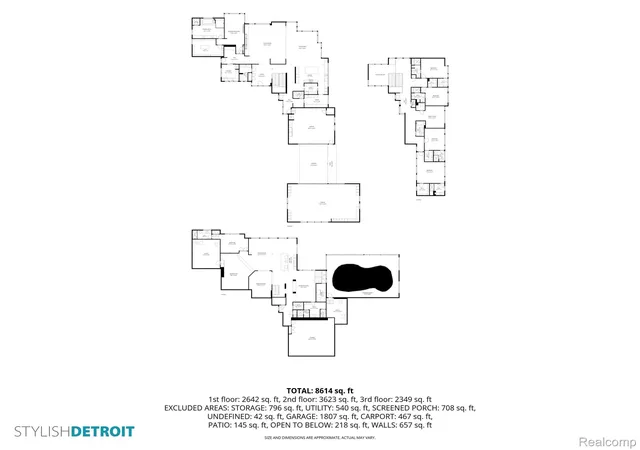
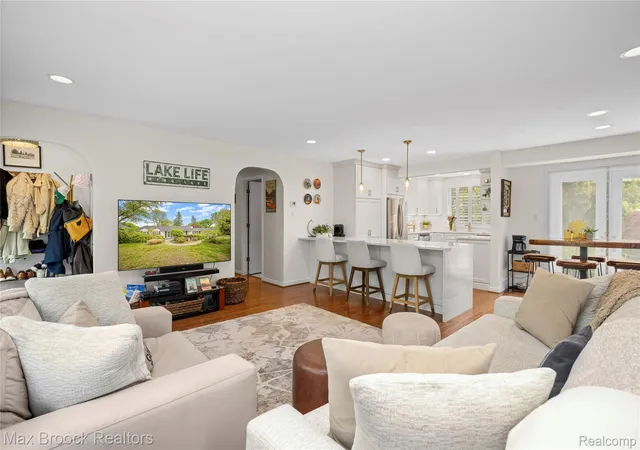
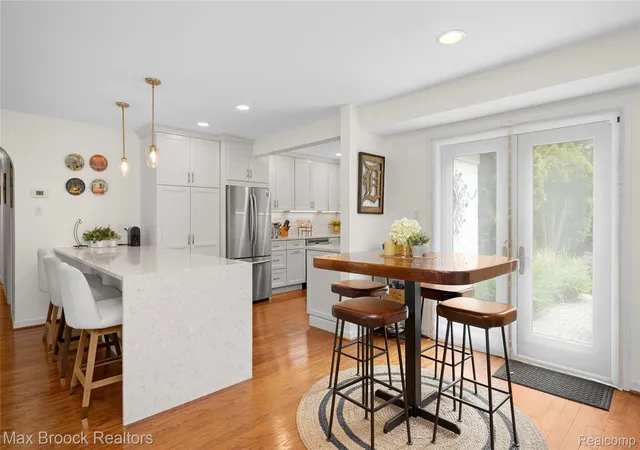
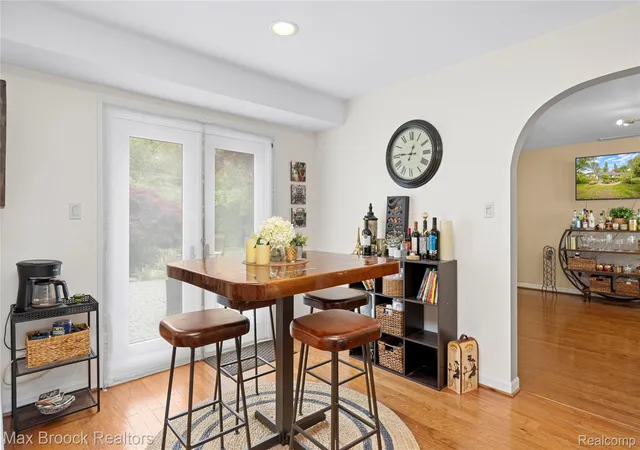
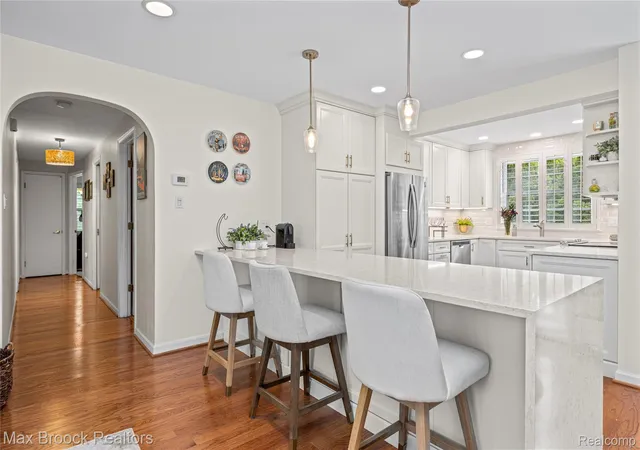
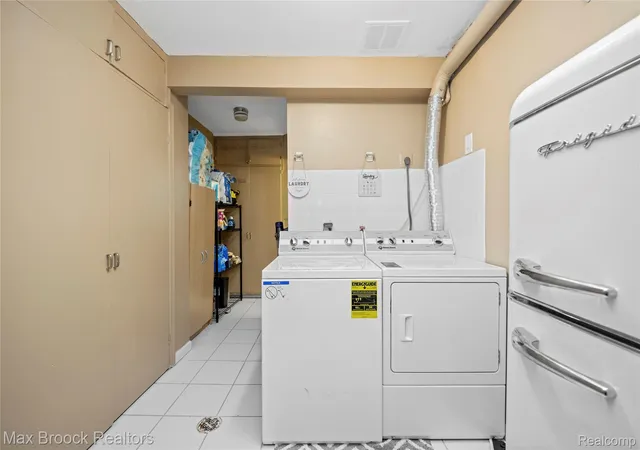
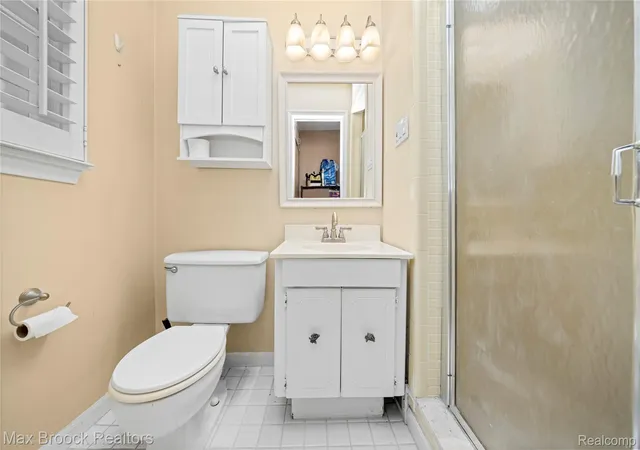
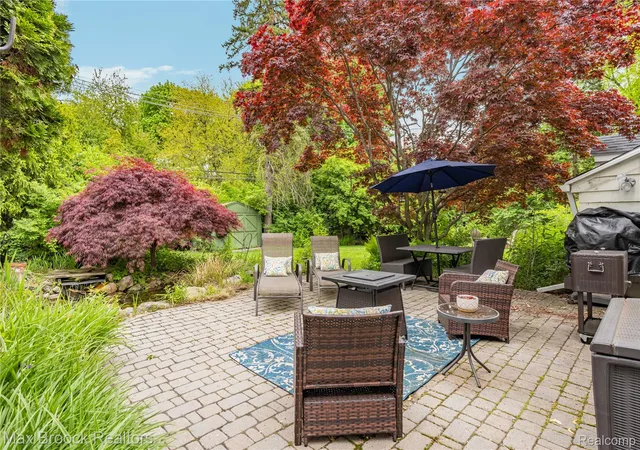
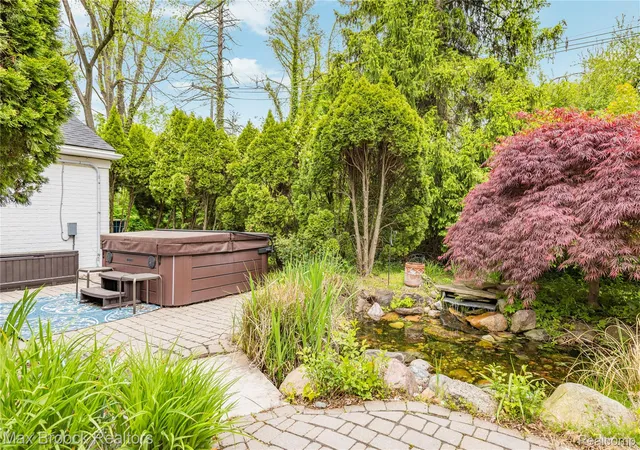
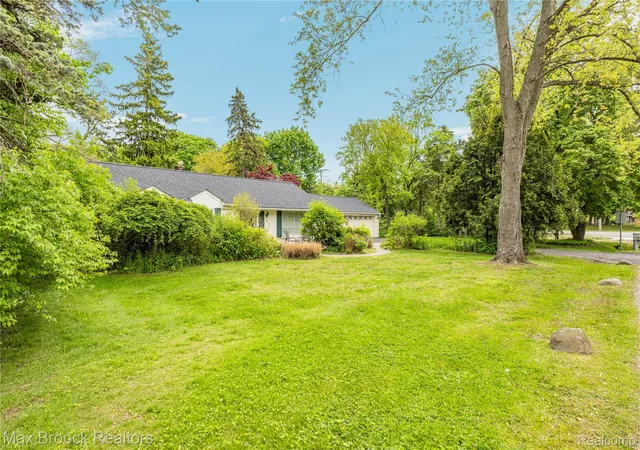
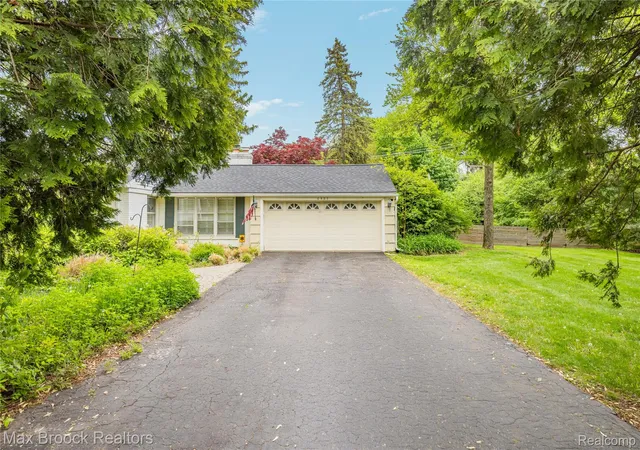
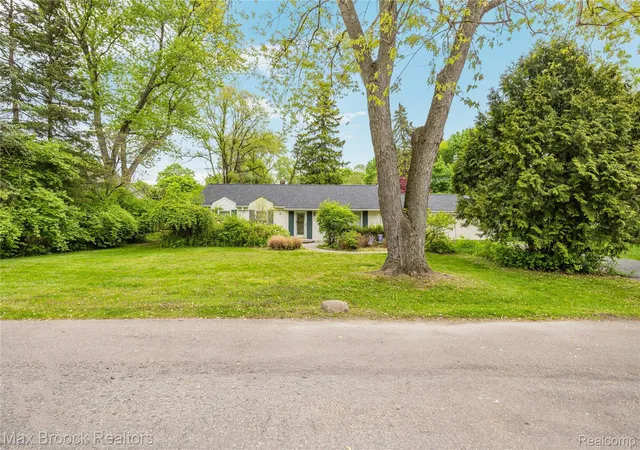
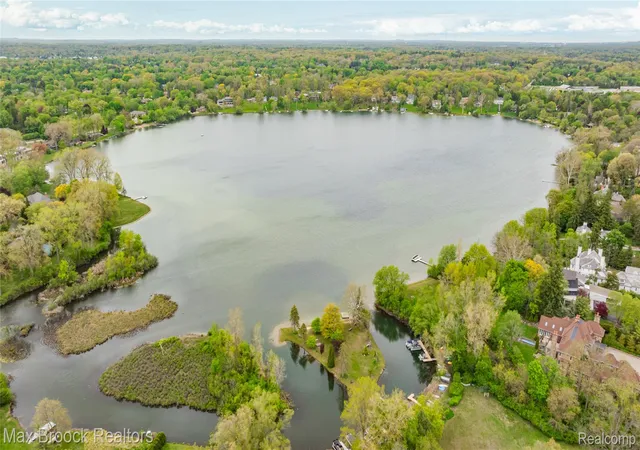
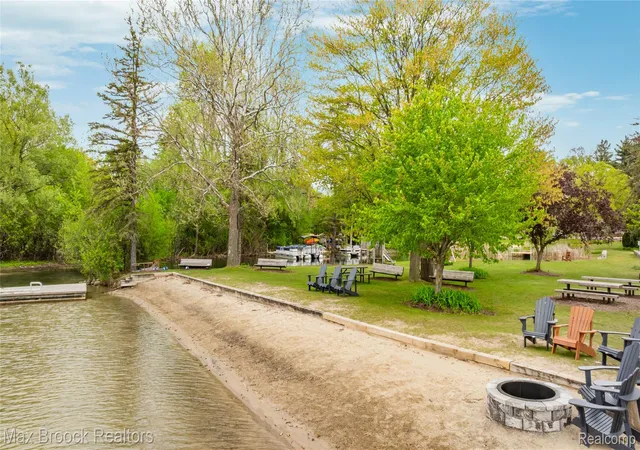
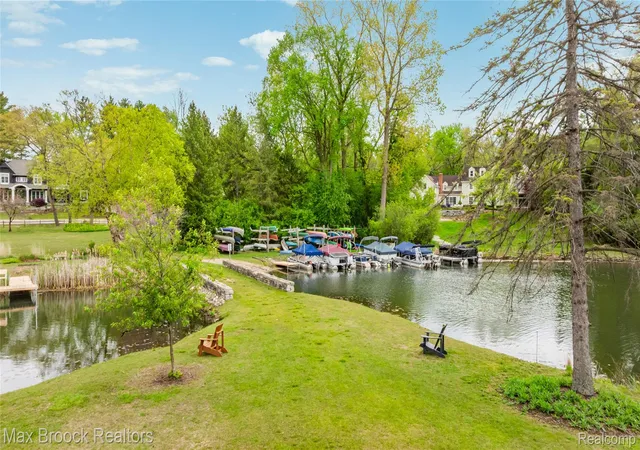
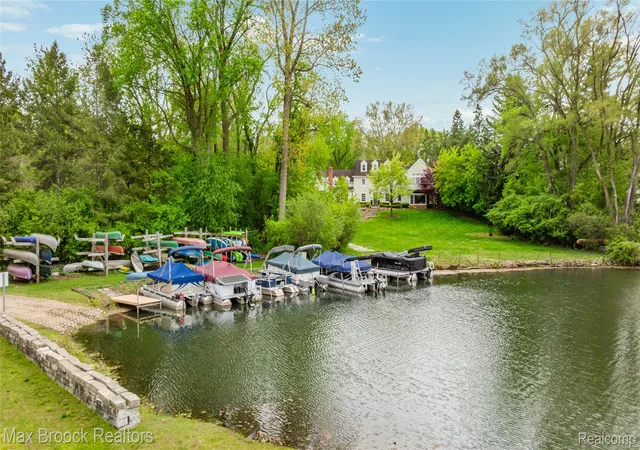
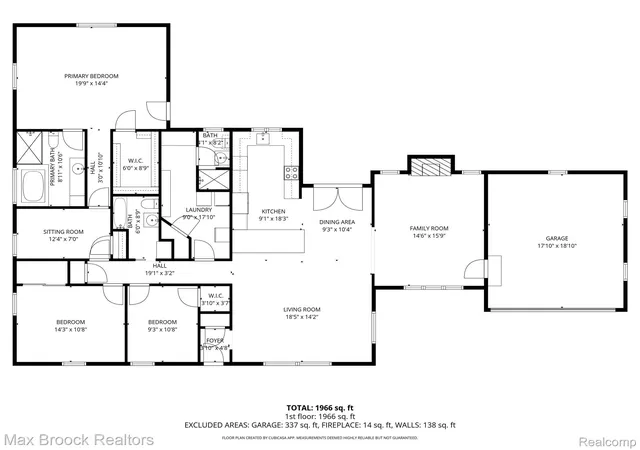





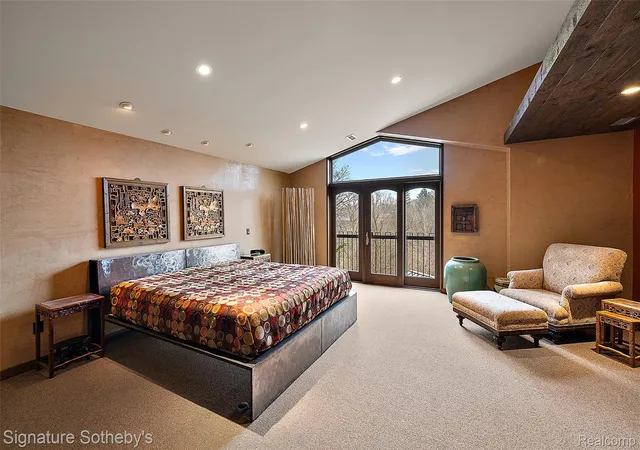
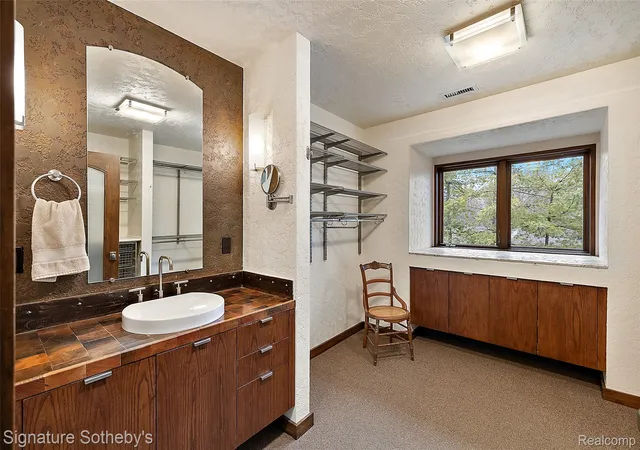
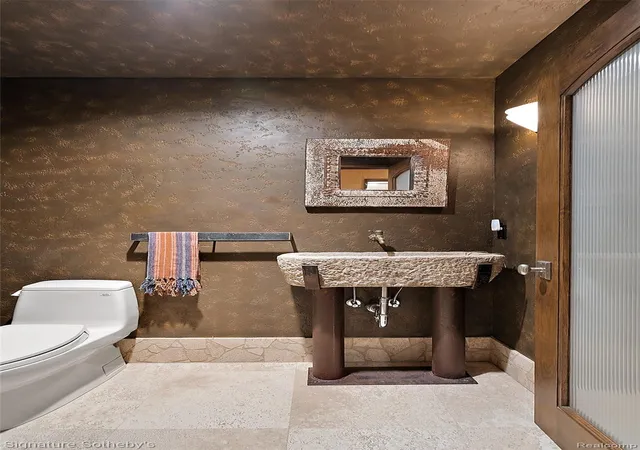

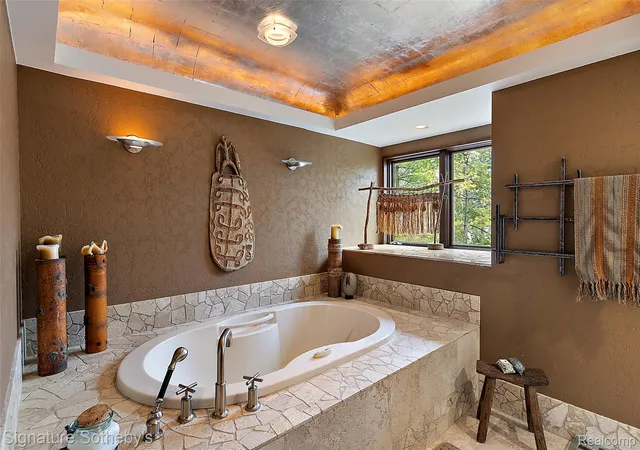



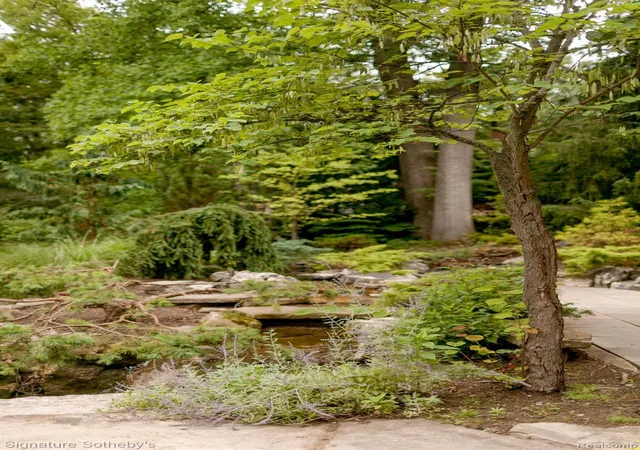
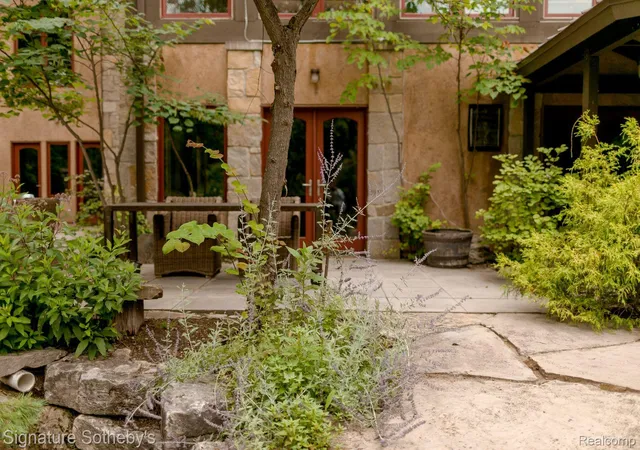
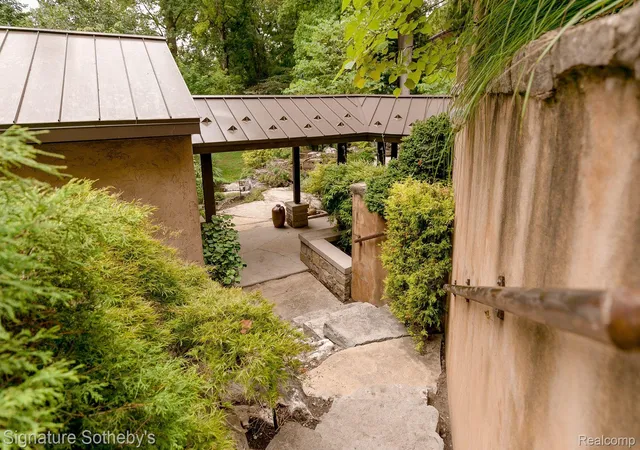
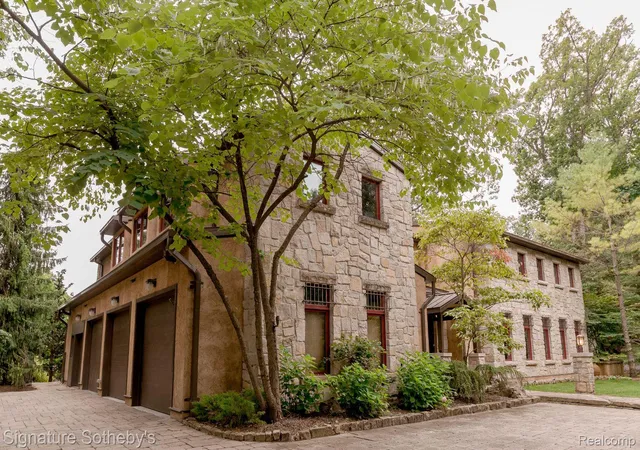
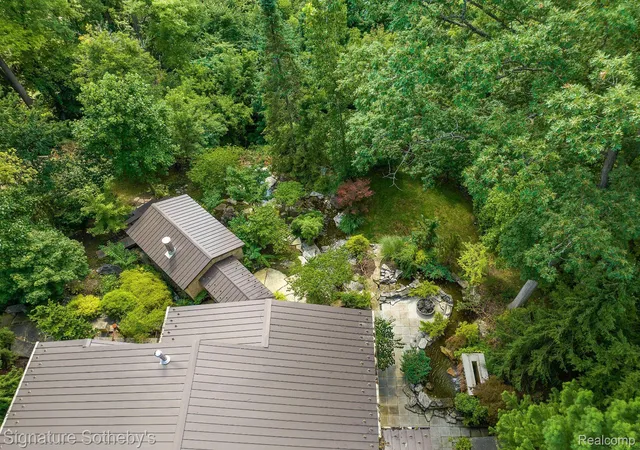
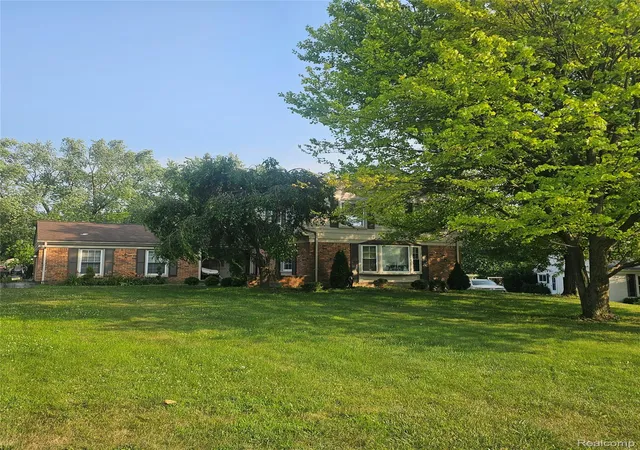
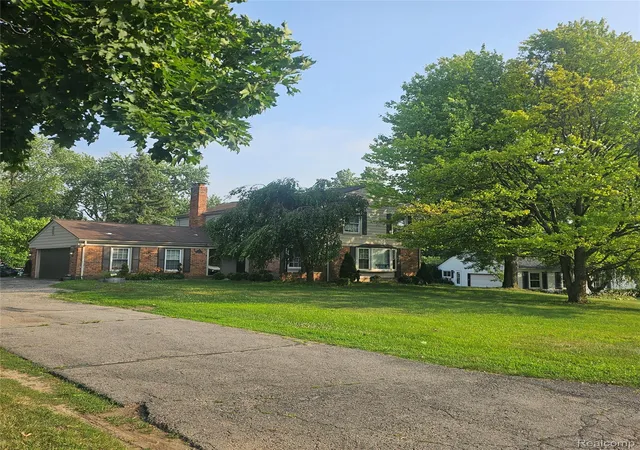
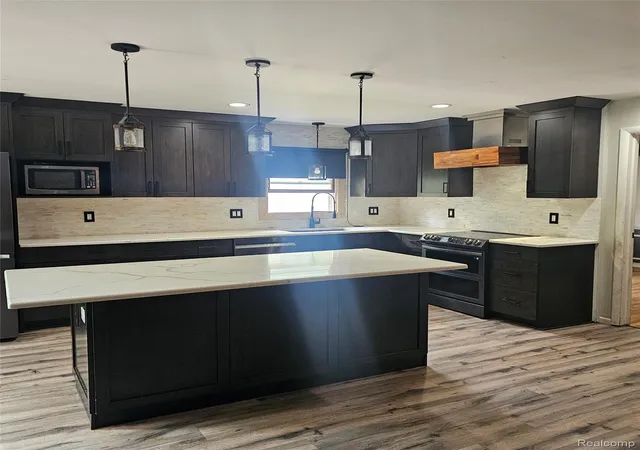
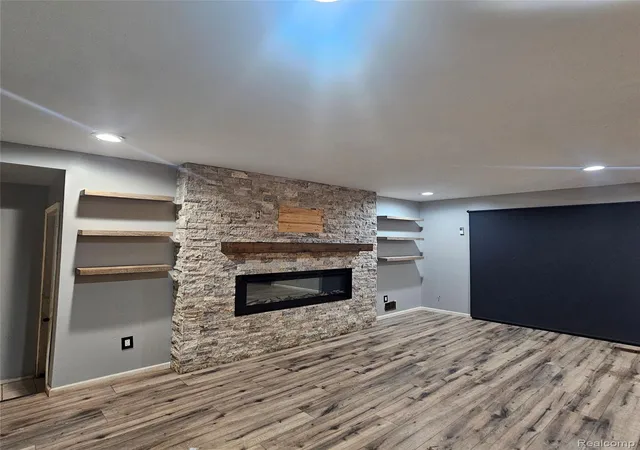
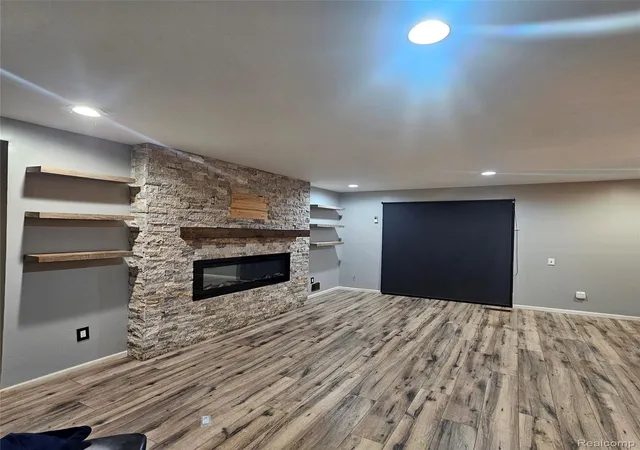
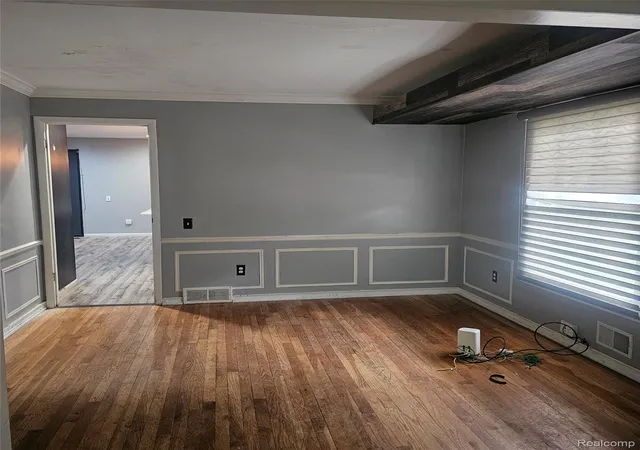

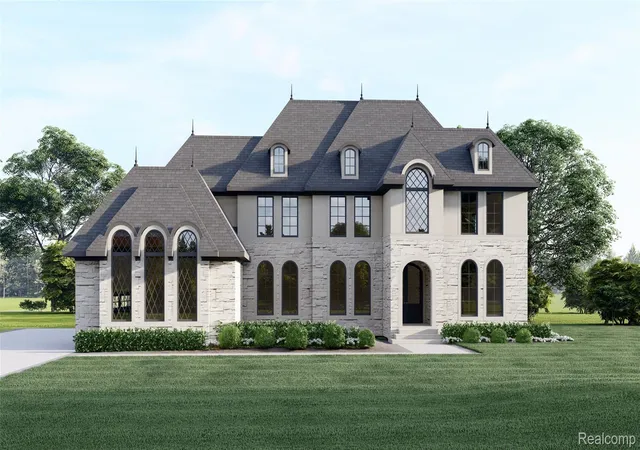
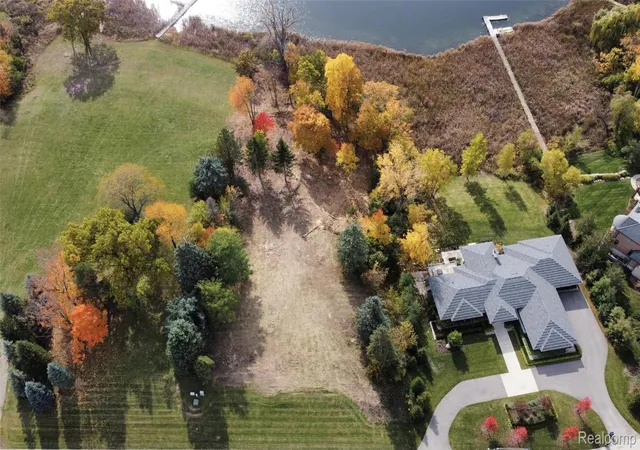
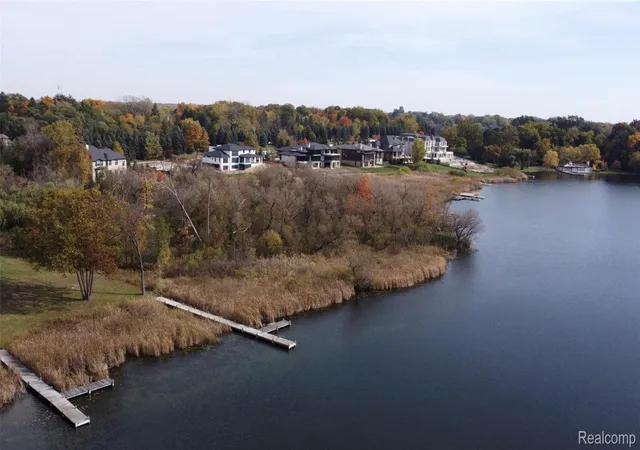
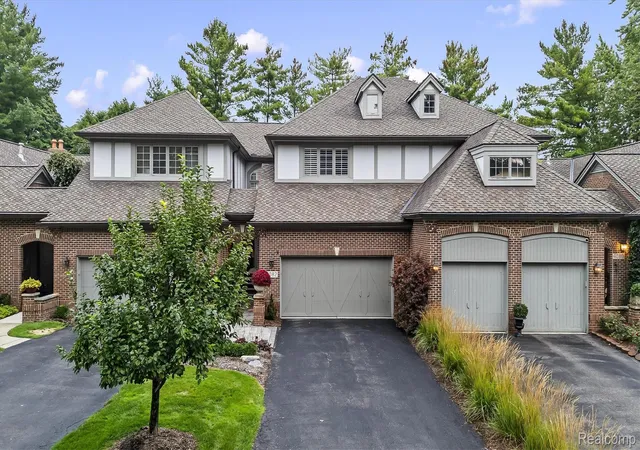
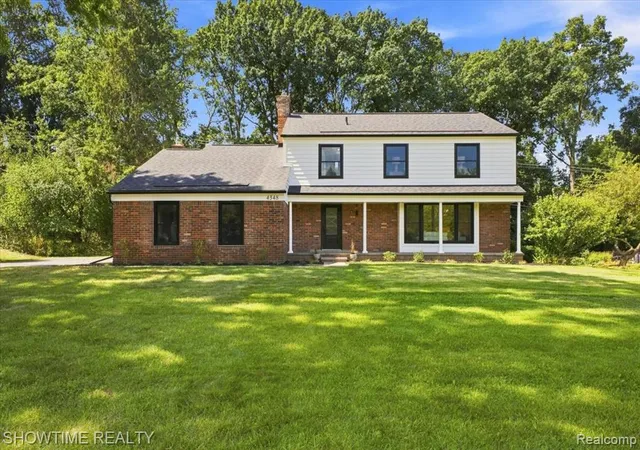
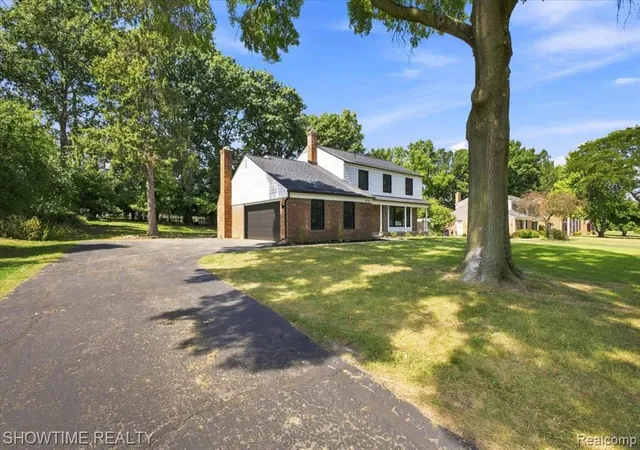
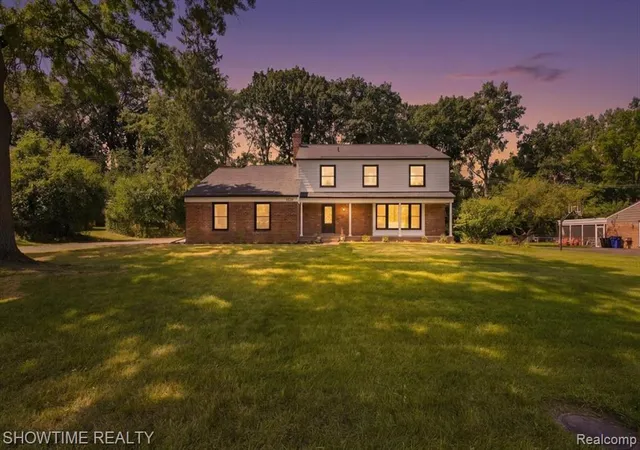
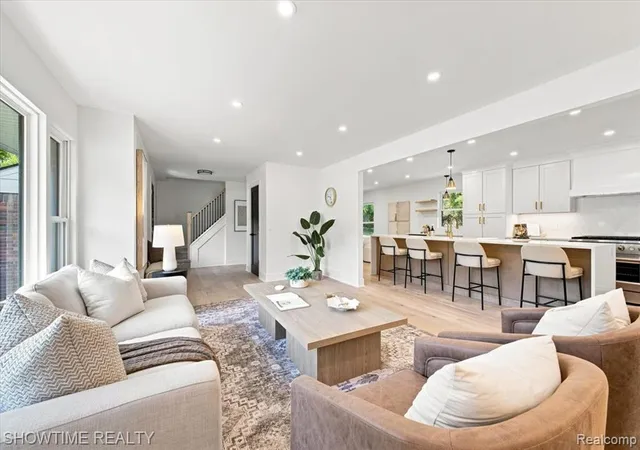
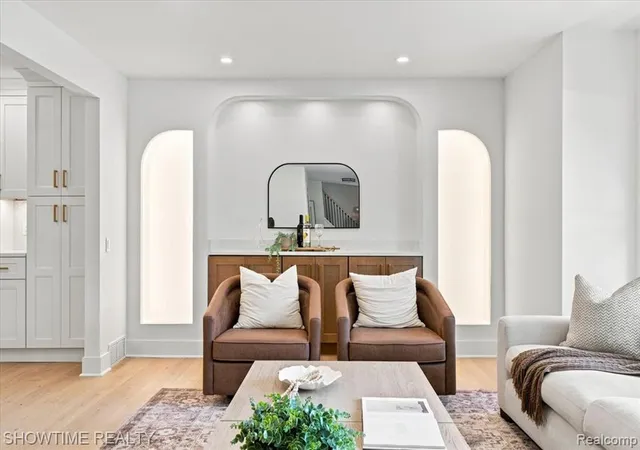
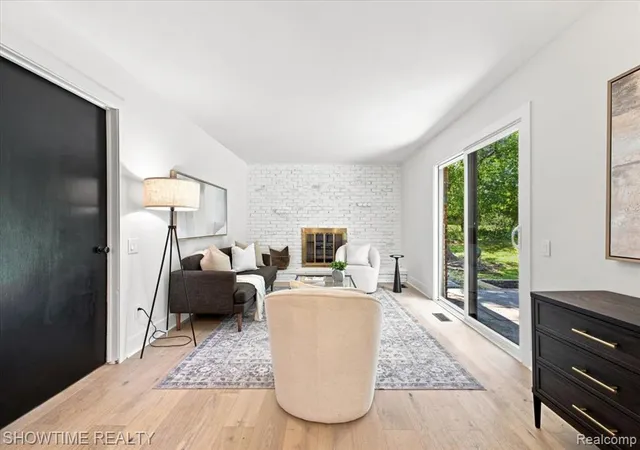
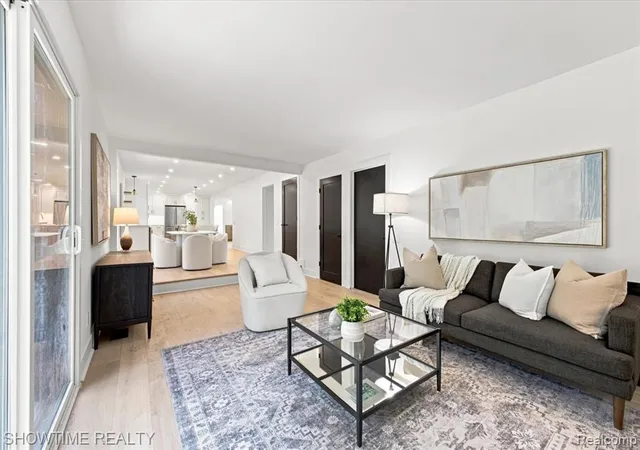
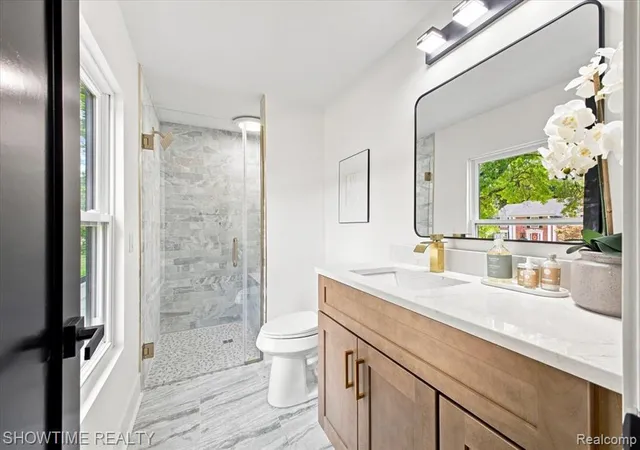
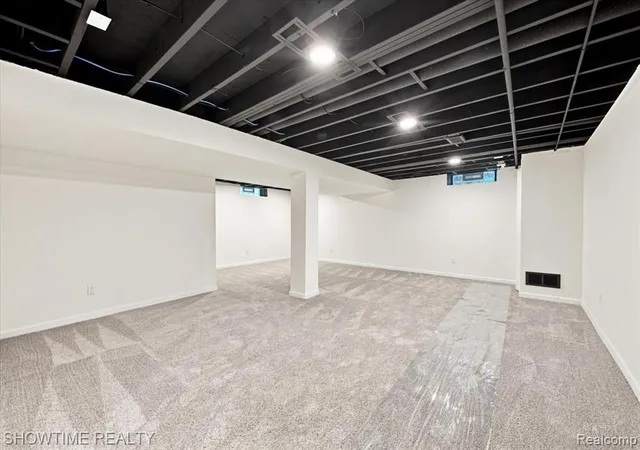
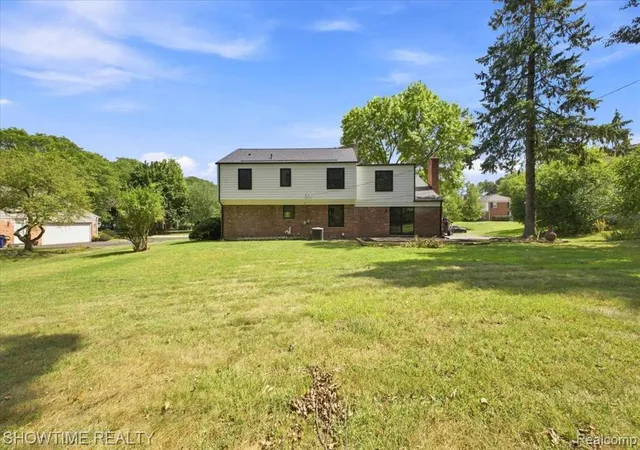
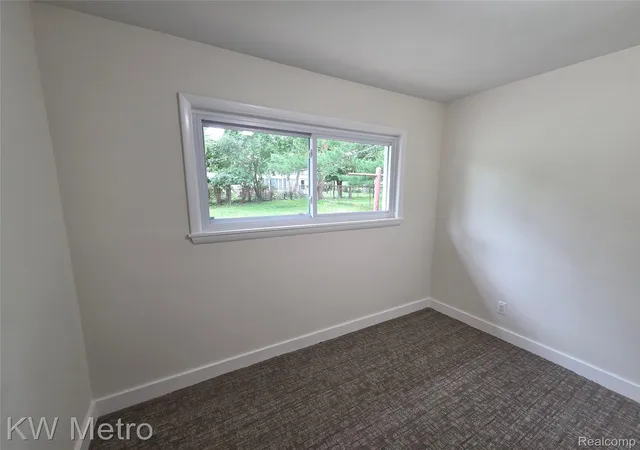
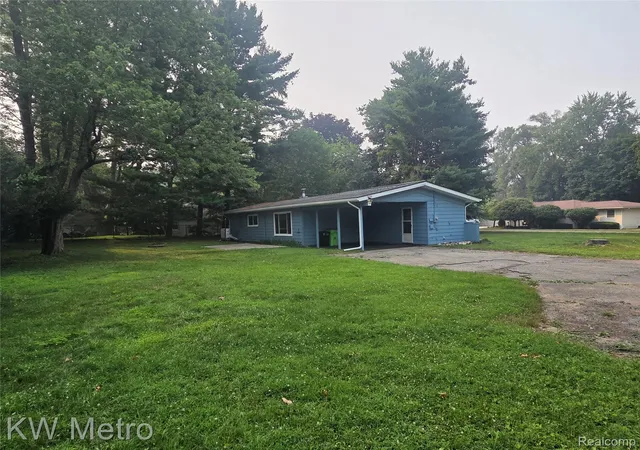
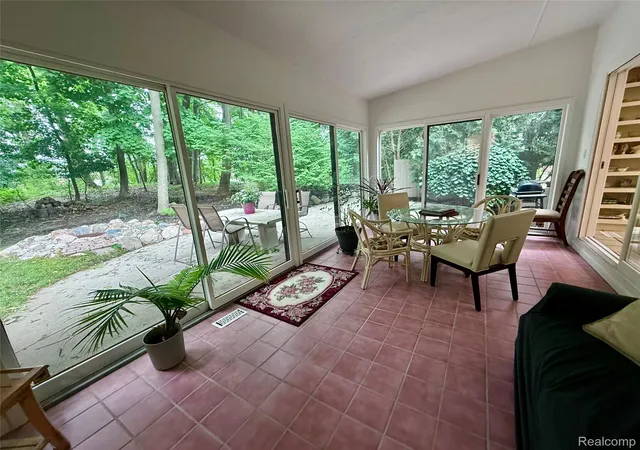
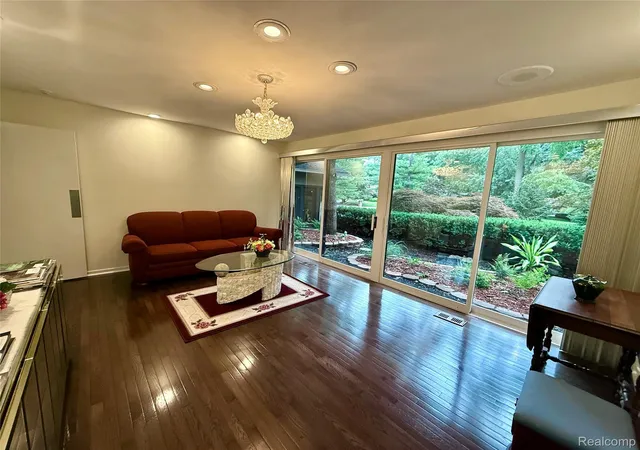
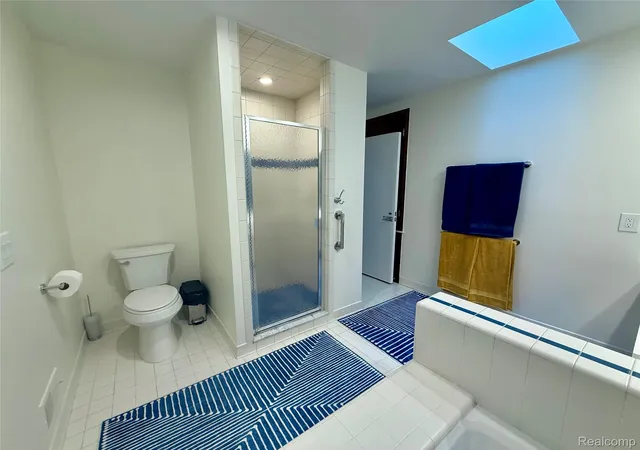
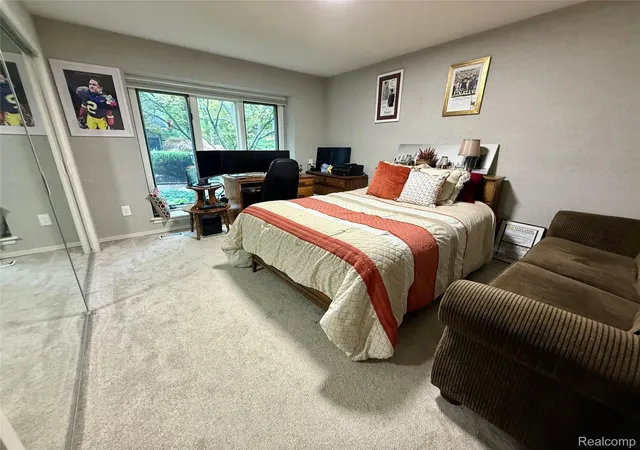
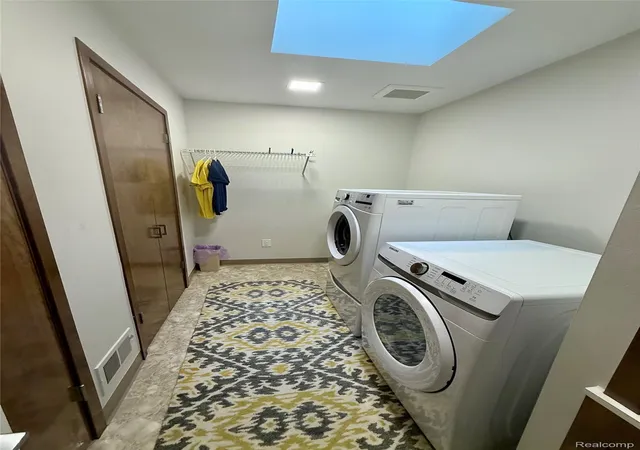

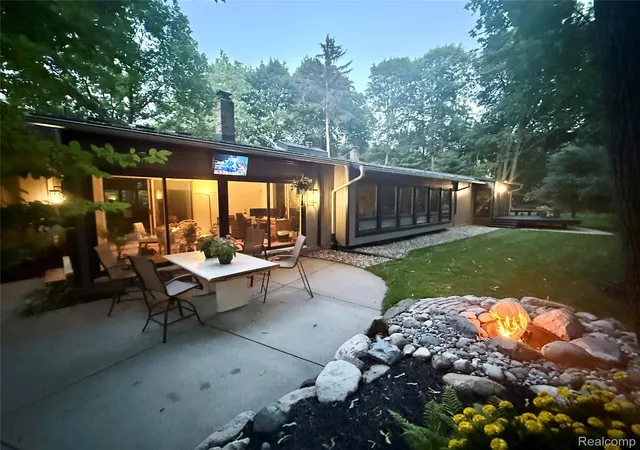
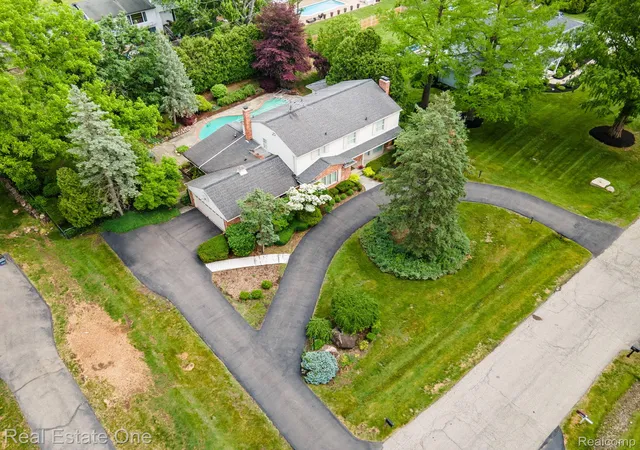
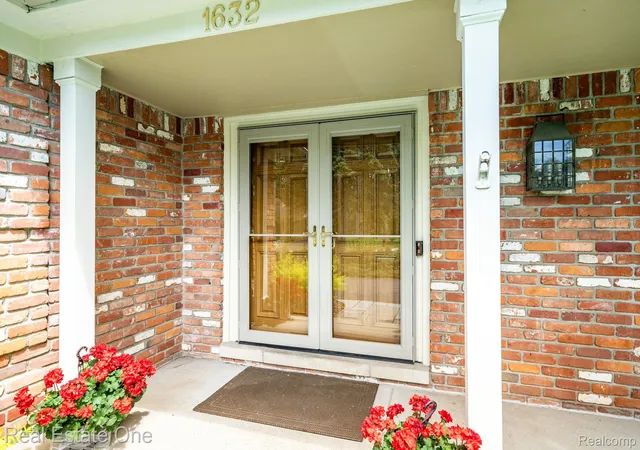
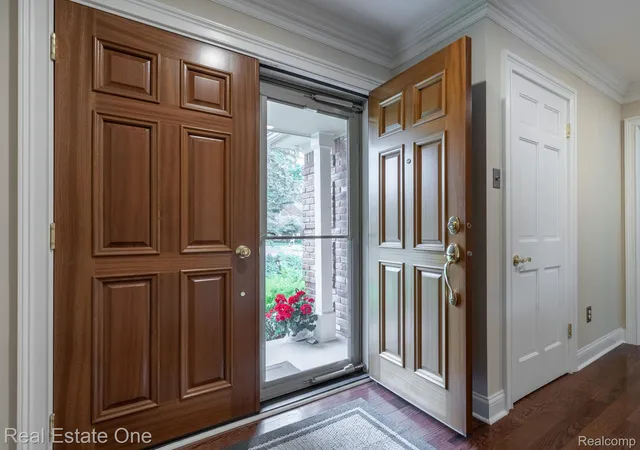
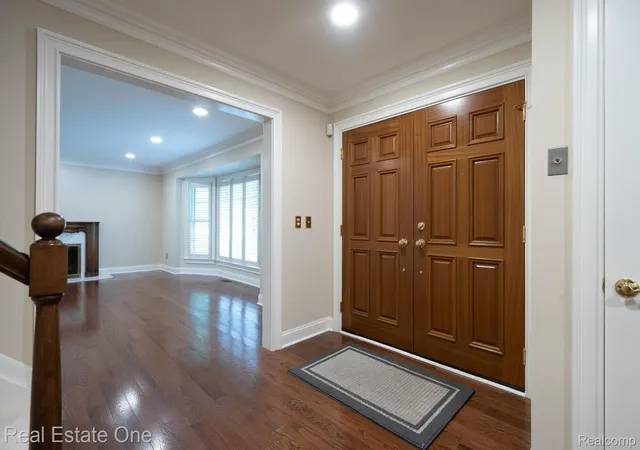
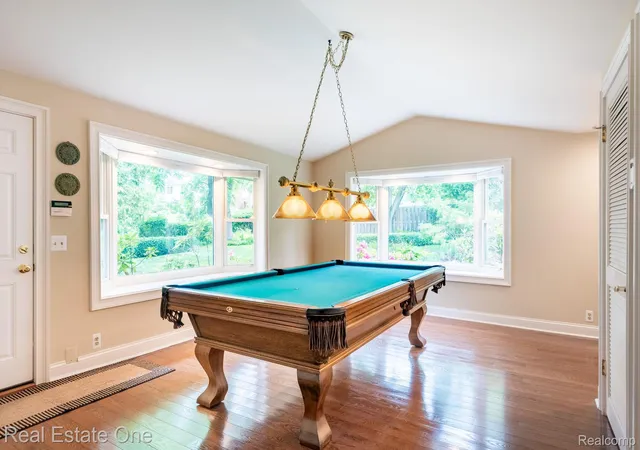
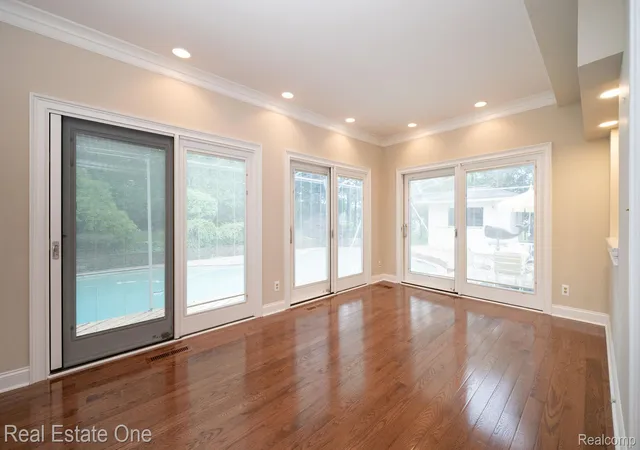
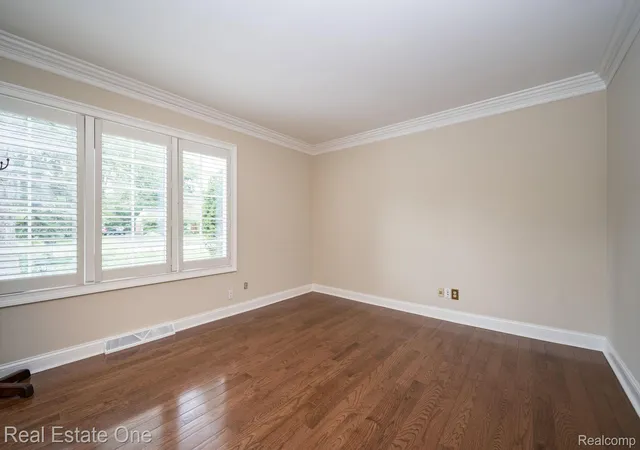
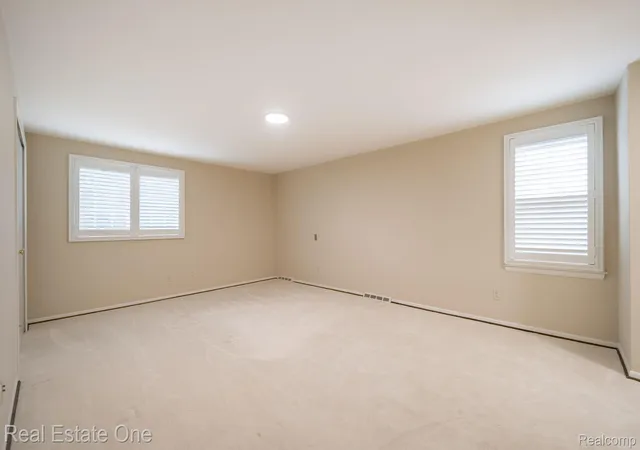
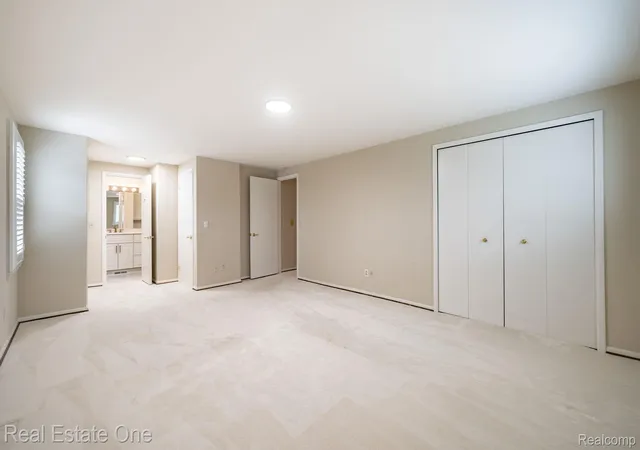
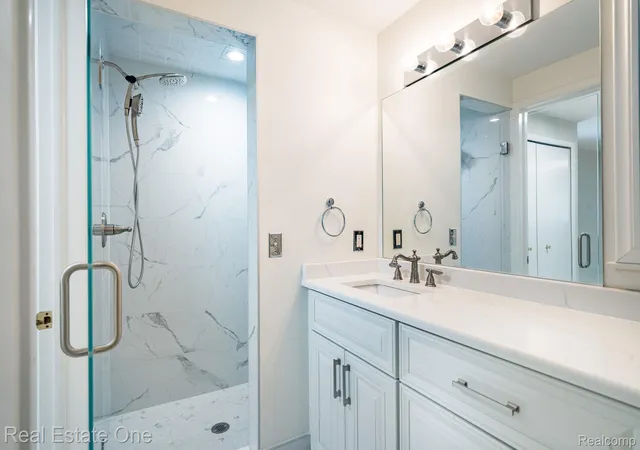
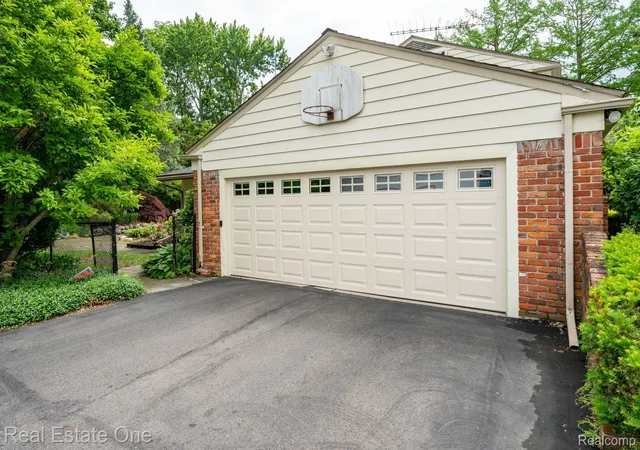
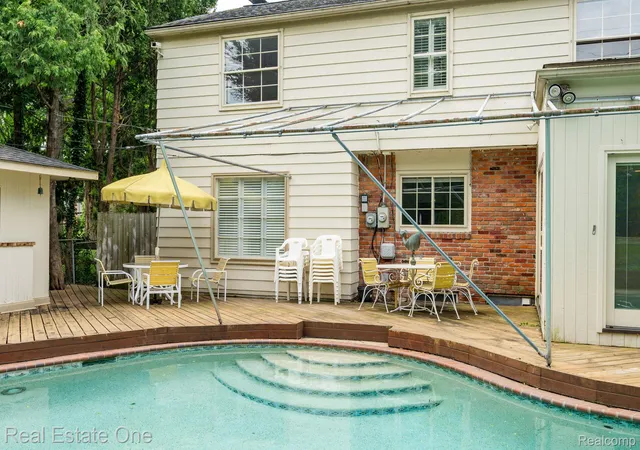
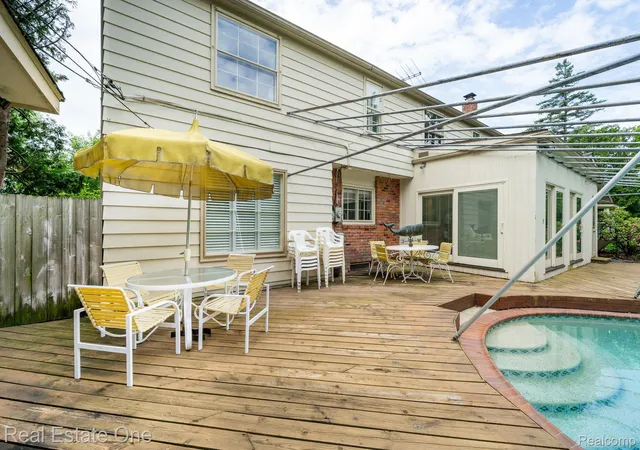
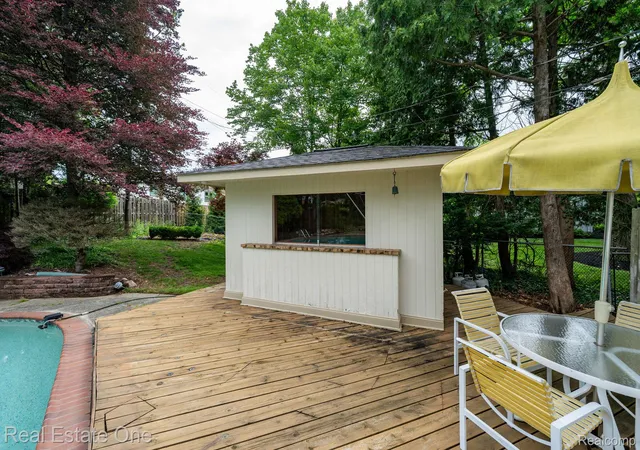

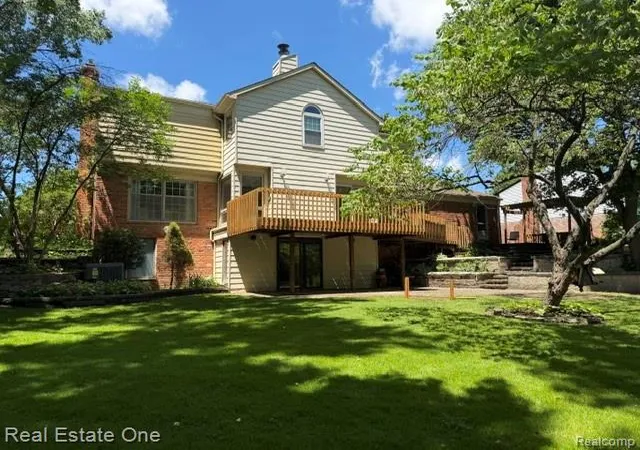


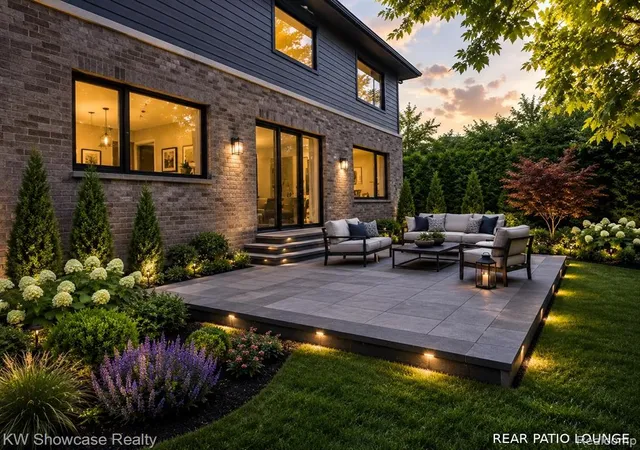
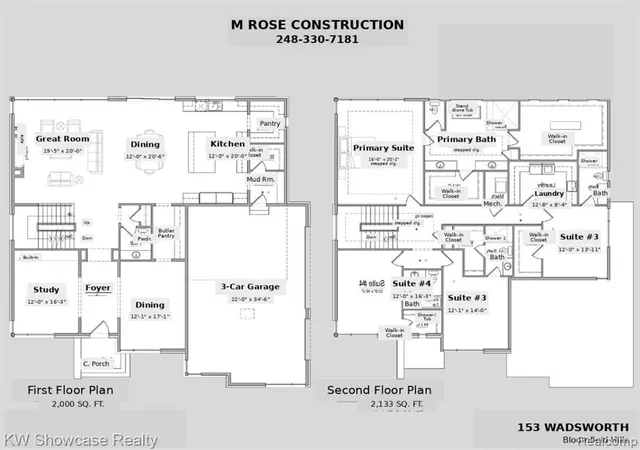

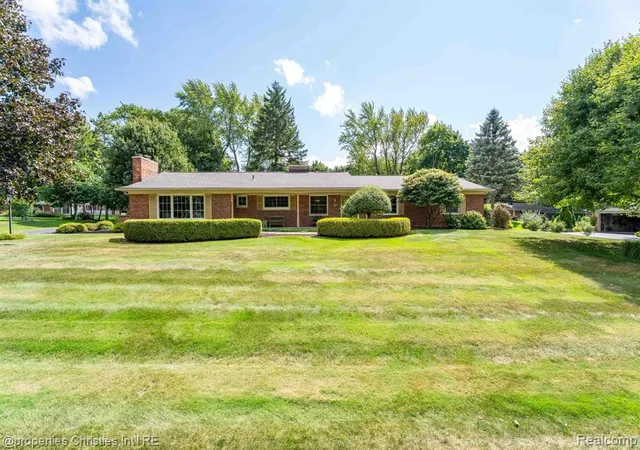
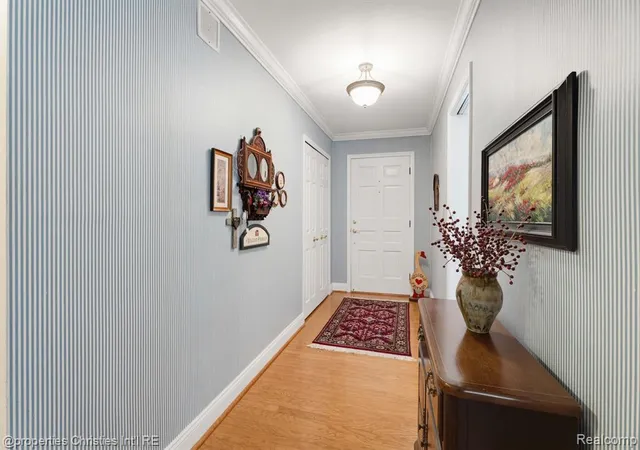
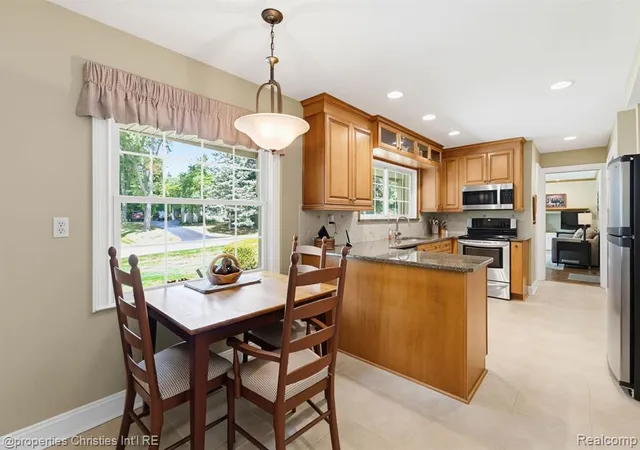
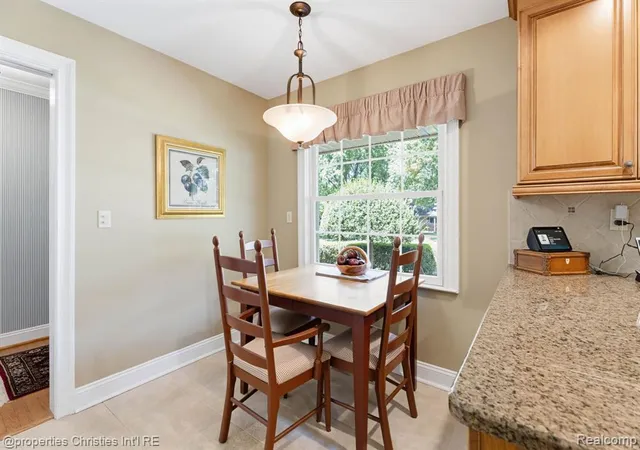
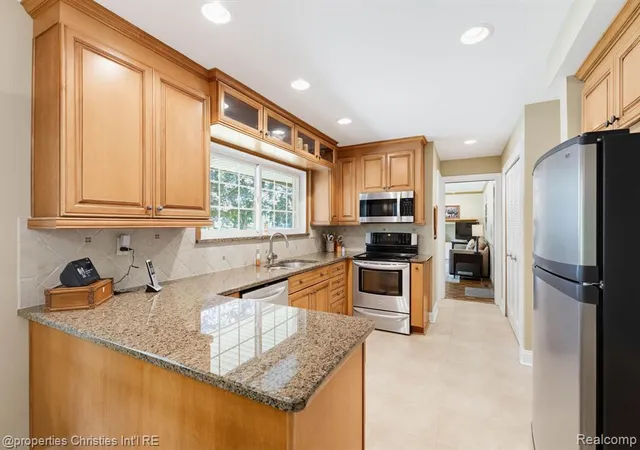
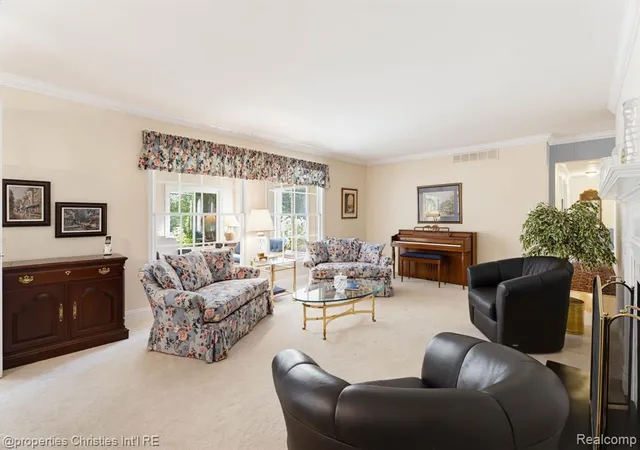
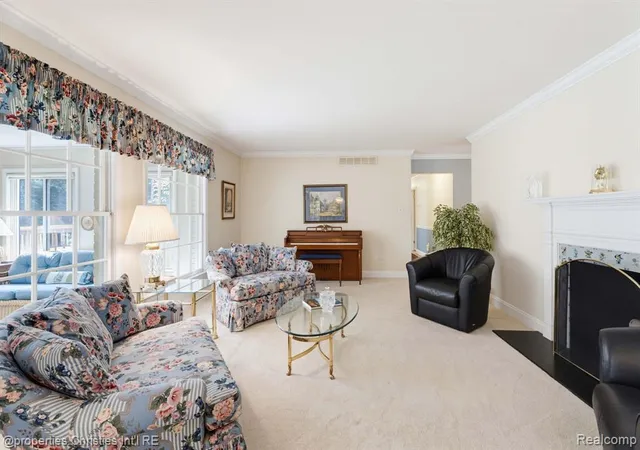
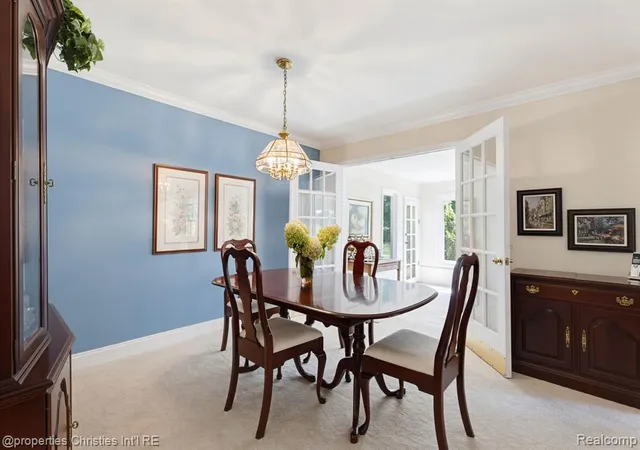
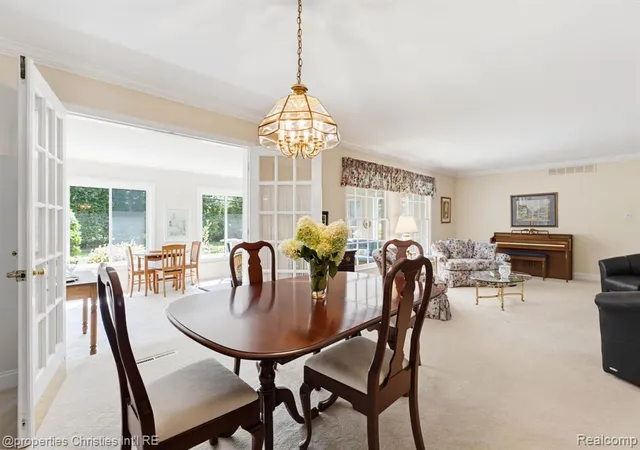
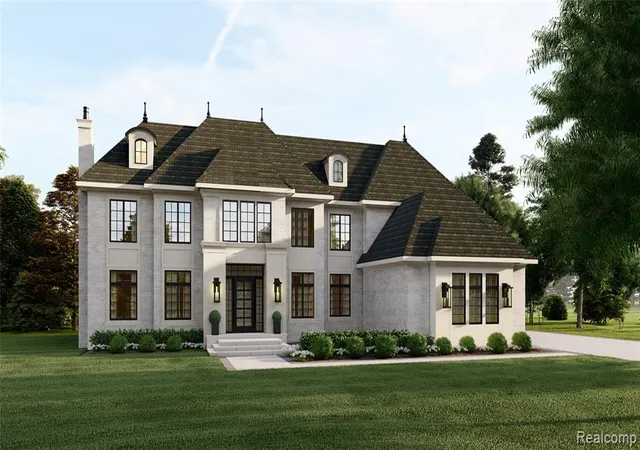

Top 3 Safest Places to Retire in Michigan
Top 3 Safest Places to Live in Michigan for Families
Top 3 Safest Places to Live in Michigan for Young Adults

 Download the App Now!
4.8-star mobile app
Browse 1.6 million listings
Get instant alerts for new homes
List homes on the go
Manage showings and submit offers


Frequently Asked Questions
How to buy a house in Michigan in a safe area?

Which cities are the most affordable in Michigan?
What are the safest cities to live in Michigan right now?
How does crime vary by neighborhood within a city?
What factors make a Michigan city safer for homebuyers?


Important Legal Disclosures
MLS Disclaimers
The market analysis provided on this page is for informational purposes only and does not constitute financial, investment, or legal advice. Data is sourced from public records, industry reports, and third-party providers, and while Houzeo strives for accuracy, we make no guarantees regarding the completeness, accuracy, or timeliness of the information presented.
All estimates, projections, and historical data are based on statistical models and should not be relied upon as predictions of future market conditions. Past performance is not indicative of future results, and real estate market conditions may change due to various economic and regulatory factors. Users are responsible for conducting their own due diligence before making any real estate or financial decisions. Houzeo is not liable for any decisions or actions taken based on the information provided. Any unauthorized use, duplication, or distribution of the data may violate copyright laws and result in legal consequences. Certain information, tools and services on this page may be powered by third-party vendors. Houzeo does not control or guarantee the accuracy, reliability, or functionality of such third-party services.