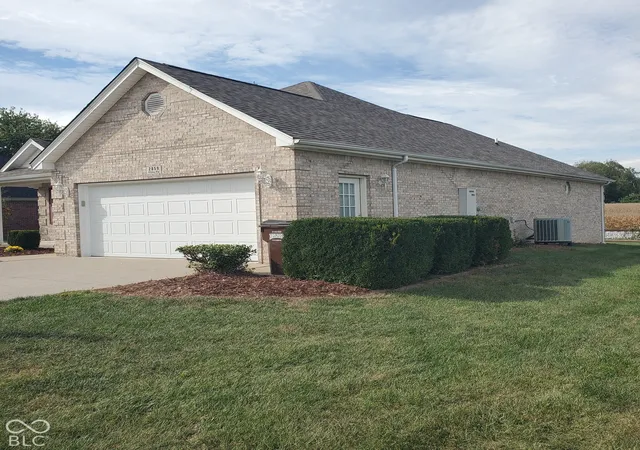
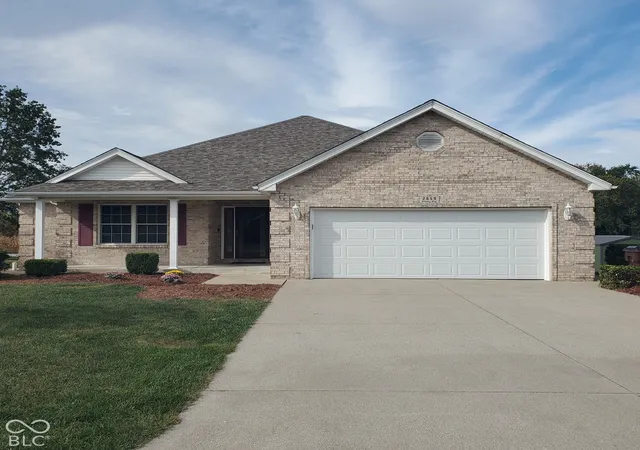
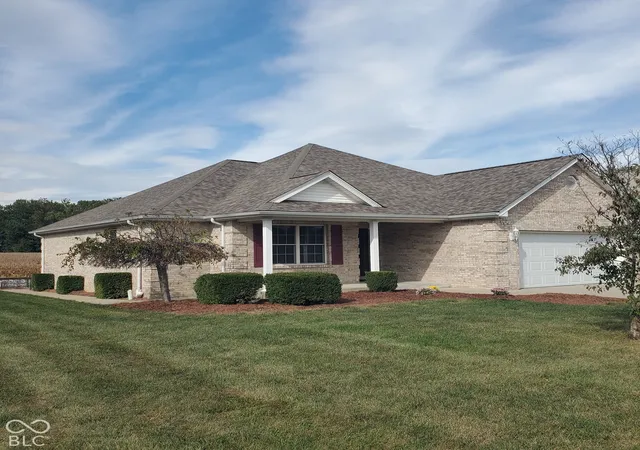

$394,900
Views: 6

Bedrooms: 4Bds
Bathrooms: 3Ba
Area: 3,468sqft
Single family home for sale
MLS ID #22129105, Joe Hoene Realty Team


Do Real Estate on the Go!
$394,900
Views: 6
Bedrooms: 4Bds
Bathrooms: 3Ba
Area: 3,468sqft
Single family home for sale
MLS ID #22129105, Joe Hoene Realty Team
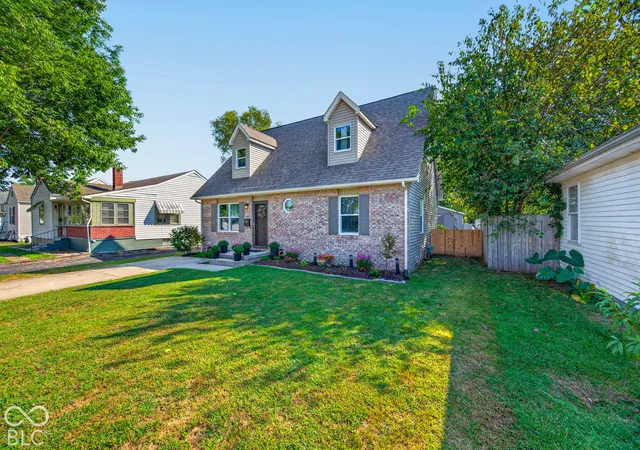
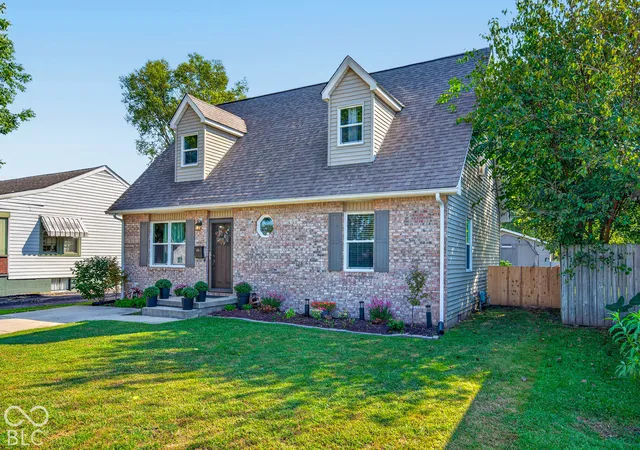
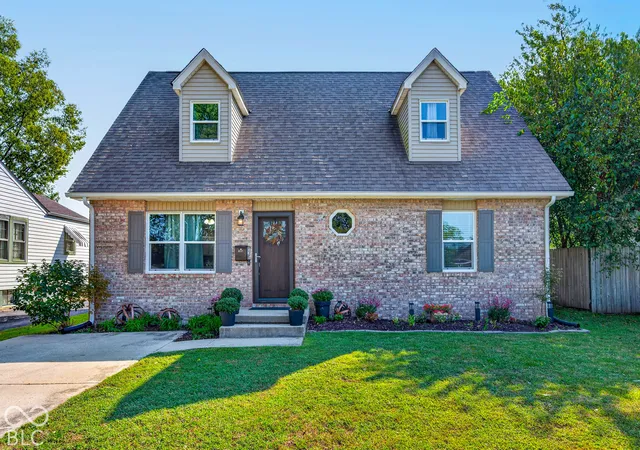
$274,900
Views: 10
Bedrooms: 3Bds
Bathrooms: 3Ba
Area: 2,016sqft
Single family home for sale
MLS ID #22127724, F.C. Tucker Real Estate Experts
 Hot
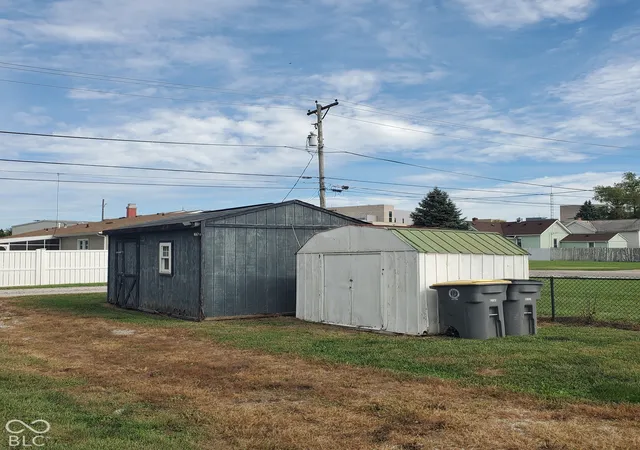
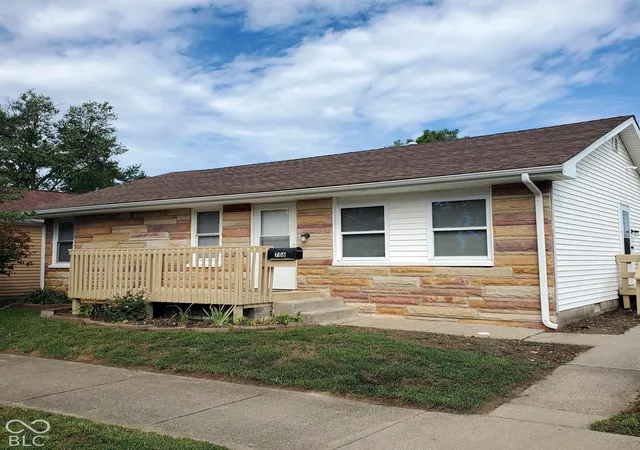
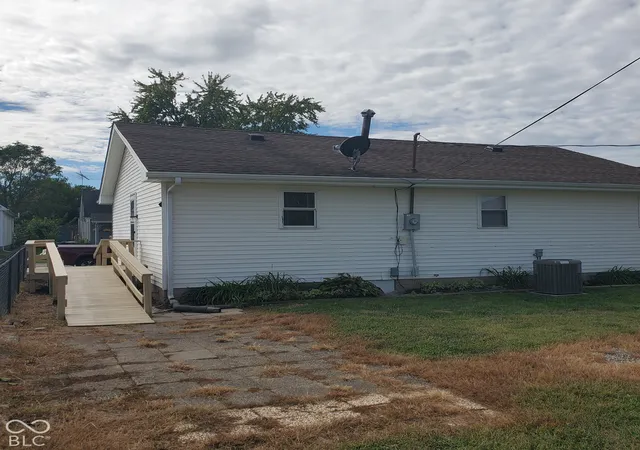
$174,900
Views: 11
Bedrooms: 3Bds
Bathrooms: 1Ba
Area: 936sqft
Sale Pending
MLS ID #22127611, Joe Hoene Realty Team
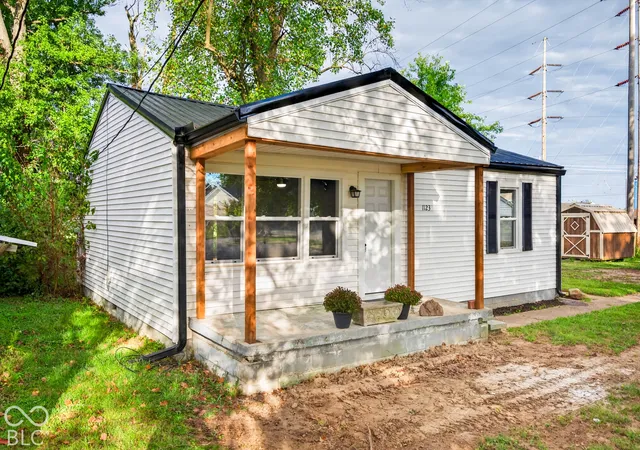
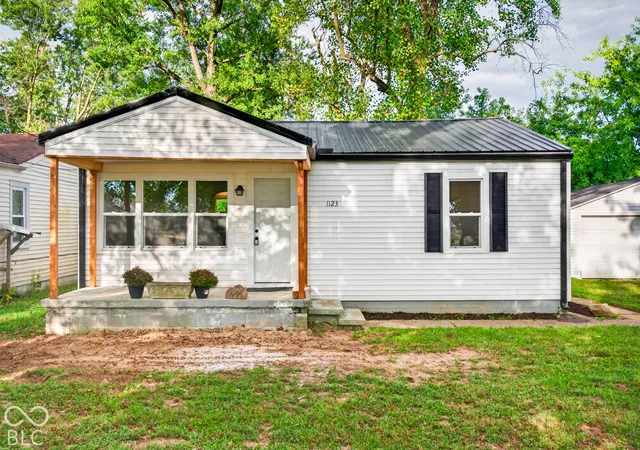
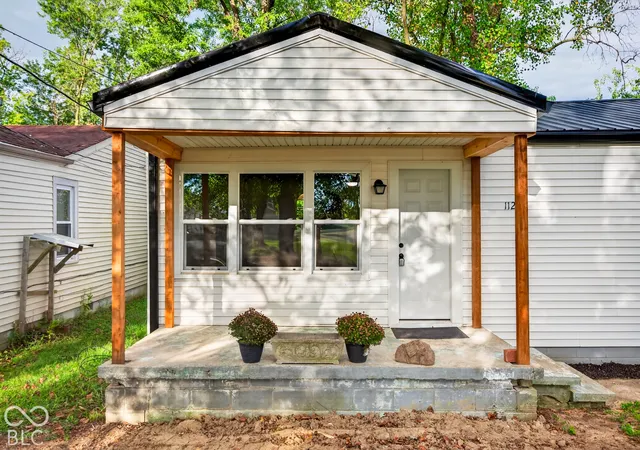
$179,000
Views: 4
Bedrooms: 2Bds
Bathrooms: 1Ba
Area: 832sqft
Single family home for sale
MLS ID #22126411, Keller Williams Indy Metro Partners
 3D Tour
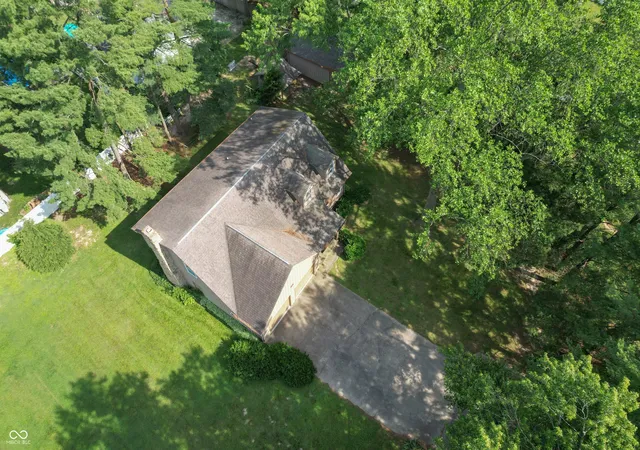
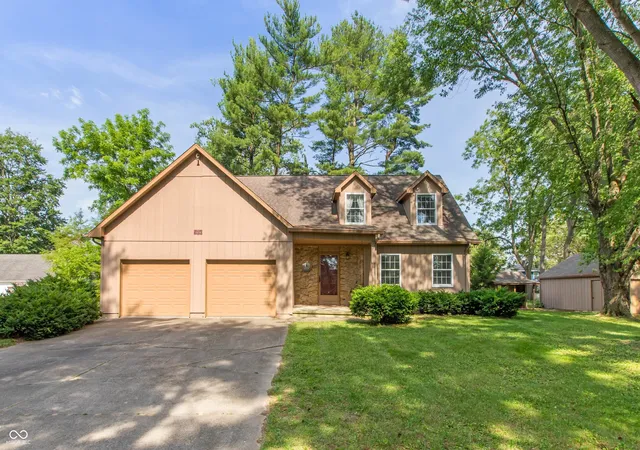
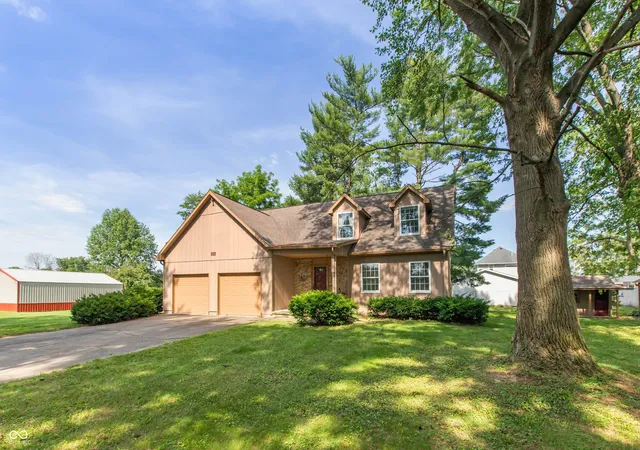
$299,900
Views: 4
Bedrooms: 4Bds
Bathrooms: 2Ba
Area: 2,311sqft
Single family home for sale
MLS ID #22106270, Re/Max Professionals
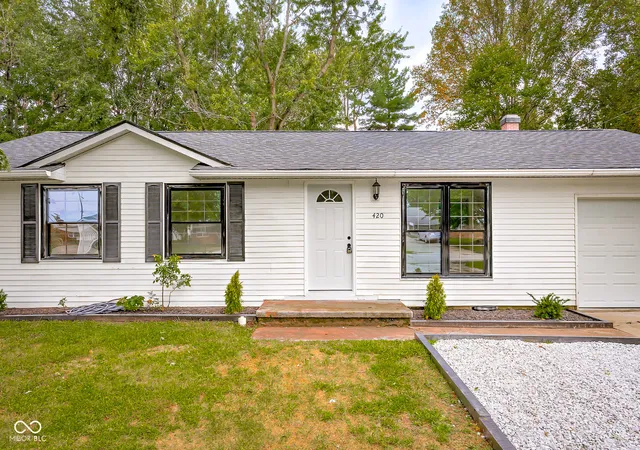
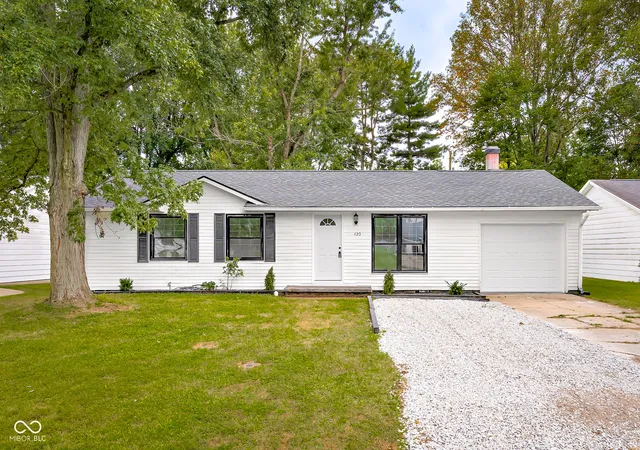
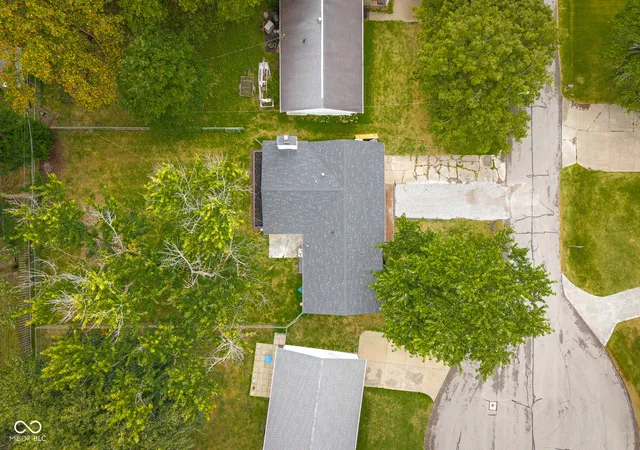
$205,000
Views: 16
Bedrooms: 3Bds
Bathrooms: 2Ba
Area: 1,612sqft
Single family home for sale
MLS ID #22126094, 1 Percent Lists Indiana Real Estate

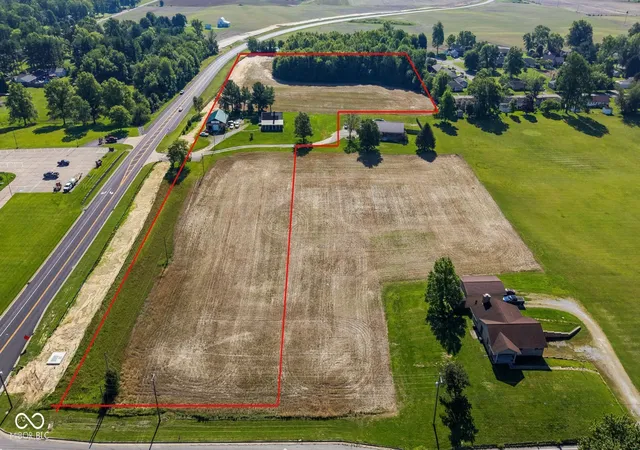

$875,000
Views: 15
Bedrooms: 4Bds
Bathrooms: 2Ba
Area: 2,856sqft
Single family home for sale
MLS ID #22105887, Your Home Team
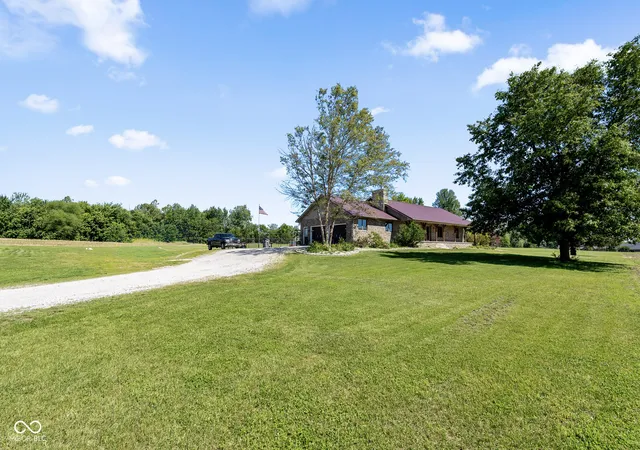
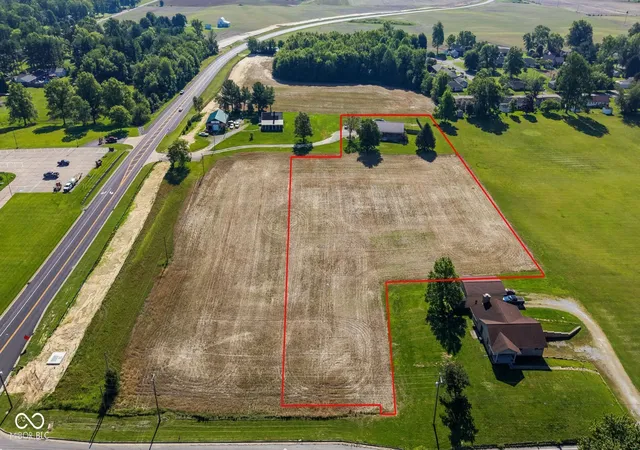
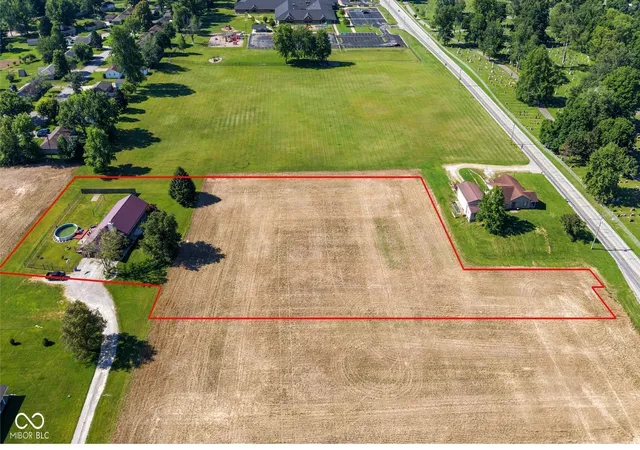
$485,000
Views: 6
Bedrooms: 3Bds
Bathrooms: 2Ba
Area: 3,239sqft
Single family home for sale
MLS ID #22106780, Your Home Team
3D Tour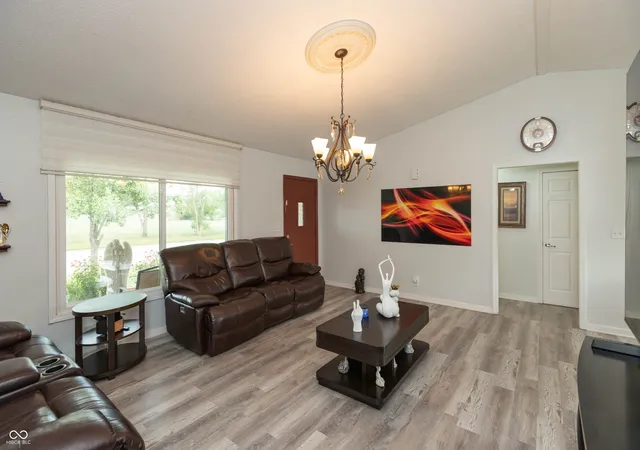
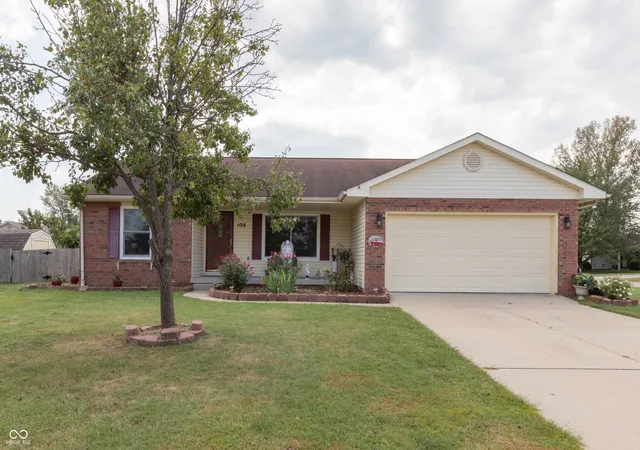
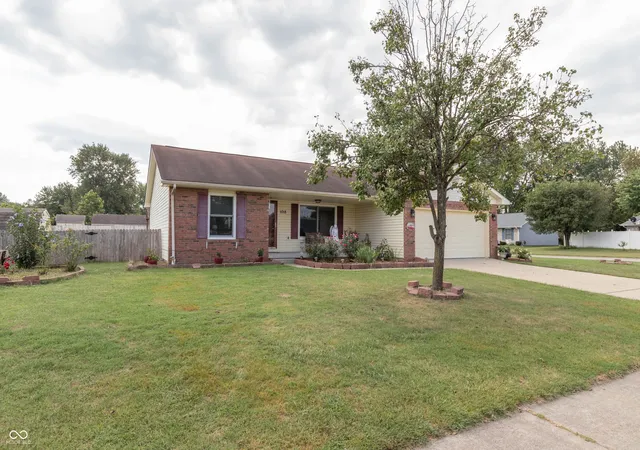
$239,900
Views: 15
Bedrooms: 3Bds
Bathrooms: 2Ba
Area: 1,664sqft
Single family home for sale
MLS ID #22125602, Re/Max Professionals


$1,699,900
Views: 12
Bedrooms: 2Bds
Bathrooms: 2Ba
Area: 2,304sqft
Single family home for sale
MLS ID #22126696, Dean Wagner Llc
3D Tour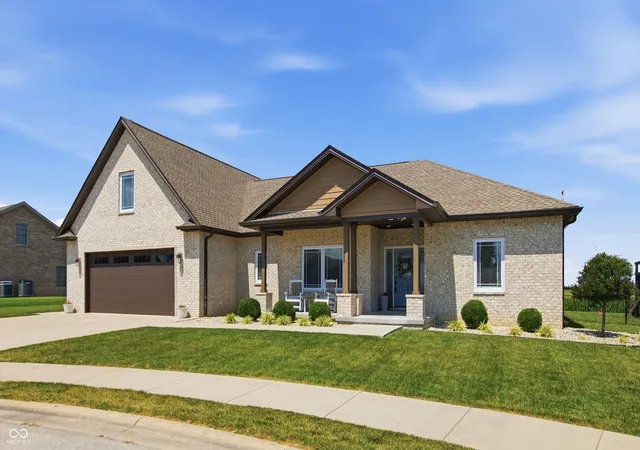
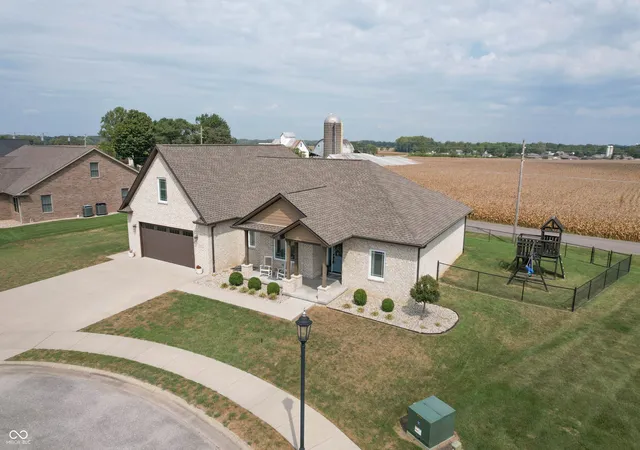
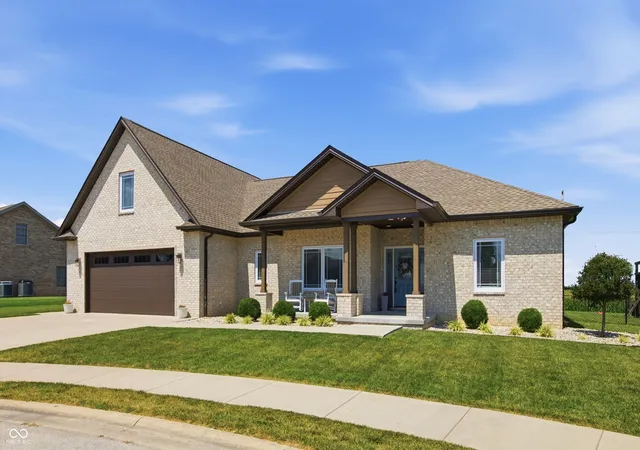
$485,000
Views: 11
Bedrooms: 4Bds
Bathrooms: 3Ba
Area: 2,804sqft
Single family home for sale
MLS ID #22115276, Re/Max Professionals
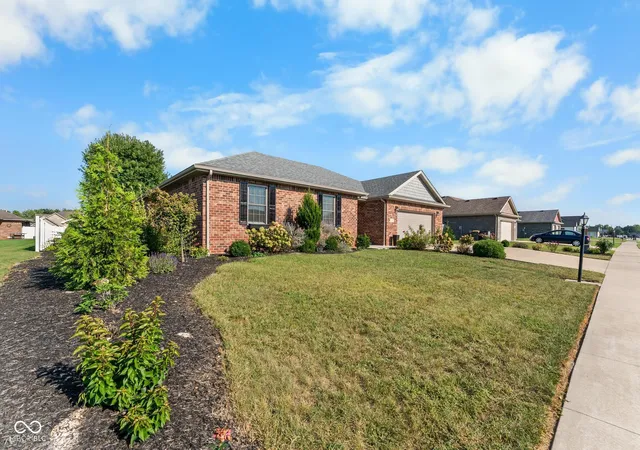
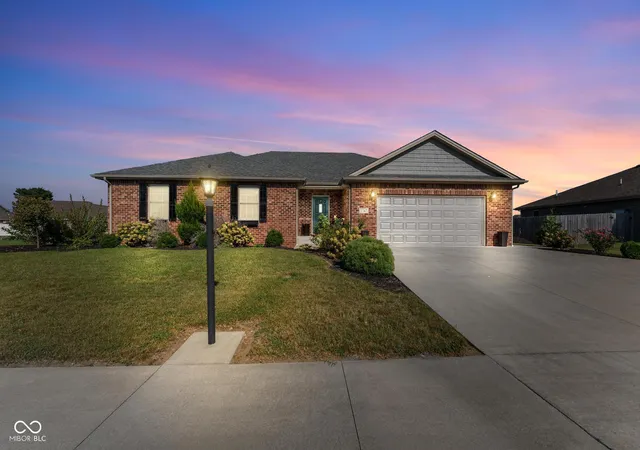
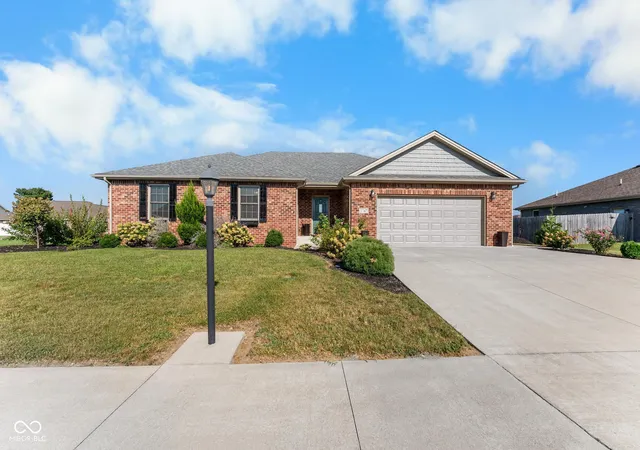
$334,900
Views: 9
Bedrooms: 3Bds
Bathrooms: 2Ba
Area: 1,896sqft
Sale Pending
MLS ID #22124382, Schuler Bauer Real Estate Powe
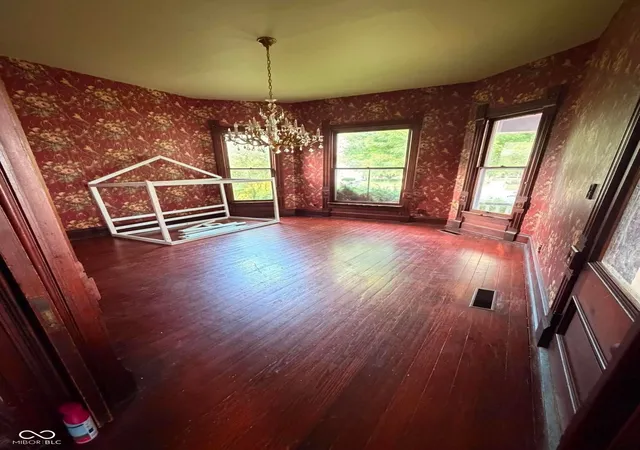
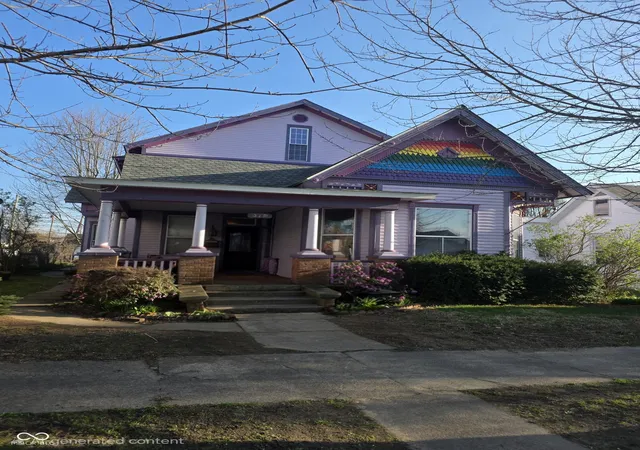
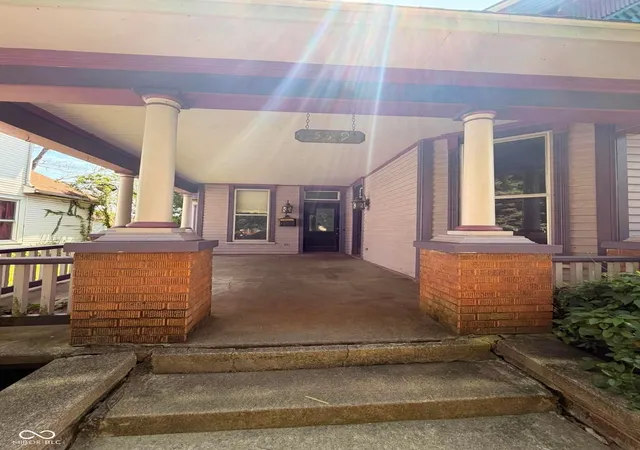
$149,000
Views: 12
Bedrooms: 3Bds
Bathrooms: 1Ba
Area: 2,596sqft
Sale Pending
MLS ID #22091805, Mensendiek Real Estate, Llc
3D Tour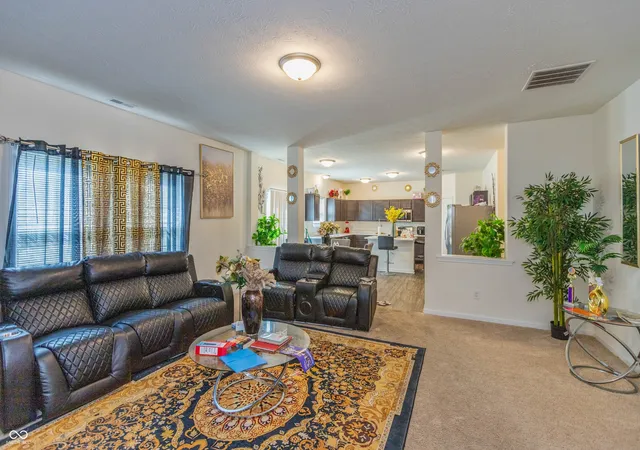
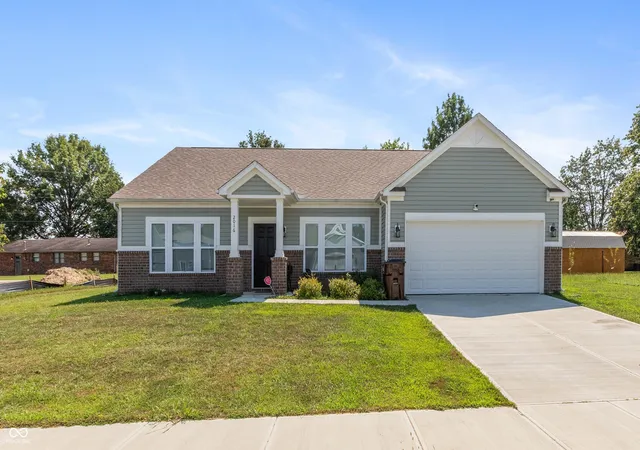
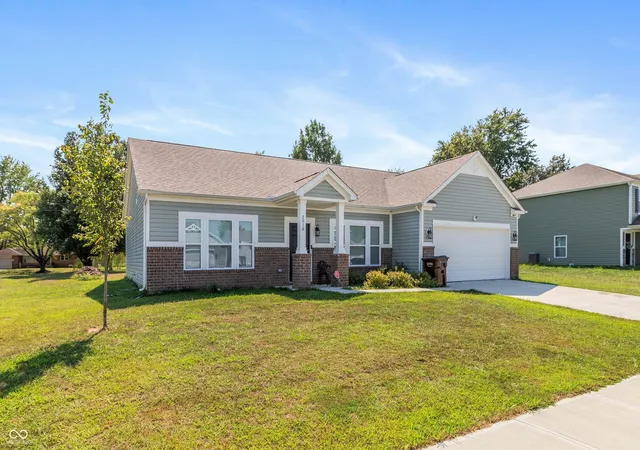
$268,500
Views: 13
Bedrooms: 3Bds
Bathrooms: 2Ba
Area: 1,656sqft
Single family home for sale
MLS ID #22118232, Re/Max Professionals
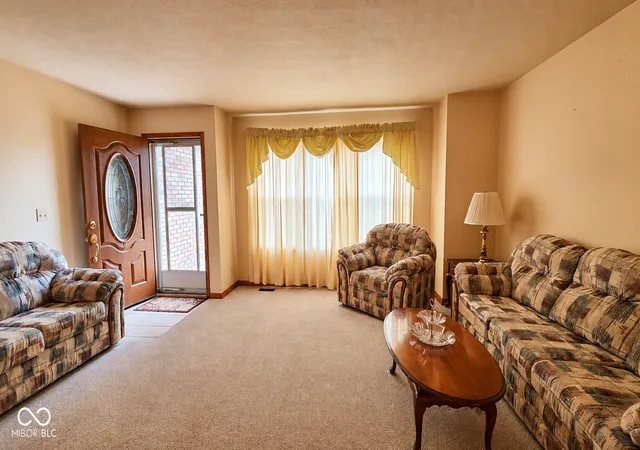
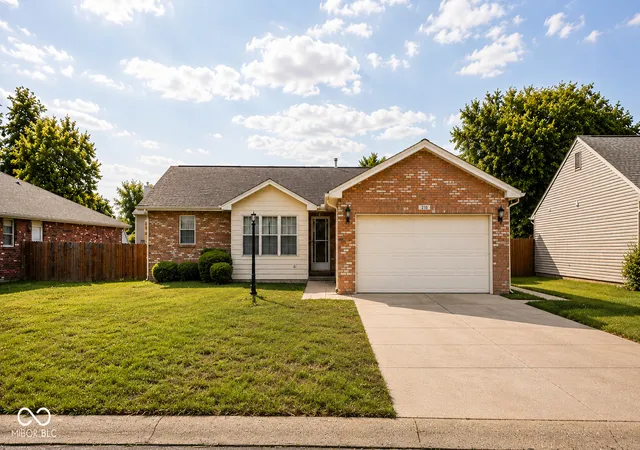
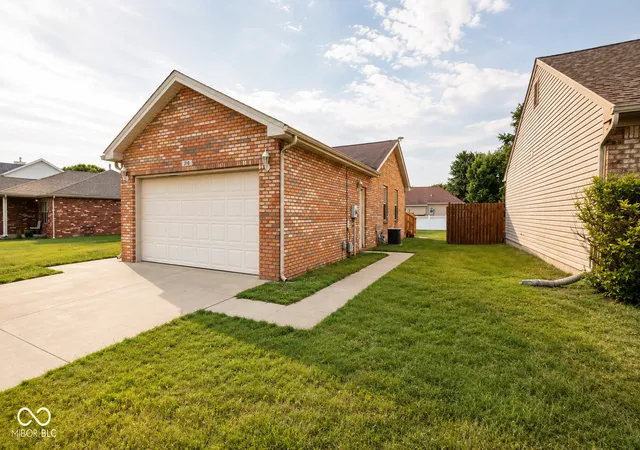
$239,900
Views: 11
Bedrooms: 3Bds
Bathrooms: 2Ba
Area: 1,728sqft
Single family home for sale
MLS ID #22100386, F.C. Tucker Real Estate Experts
 New Construction


$374,900
Views: 11
Bedrooms: 3Bds
Bathrooms: 2Ba
Area: 1,924sqft
Single family home for sale
MLS ID #22122425, Re/Max Professionals
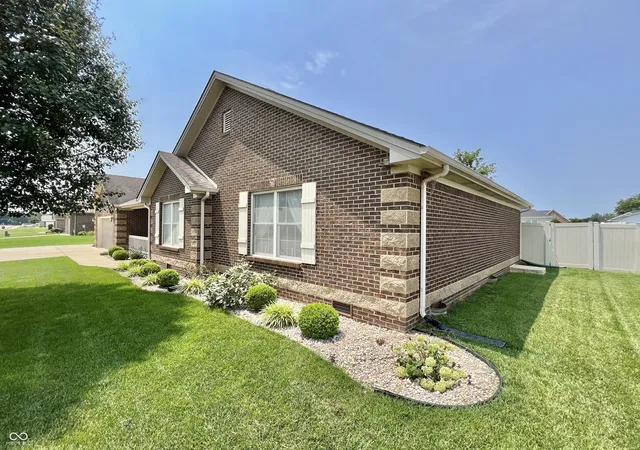
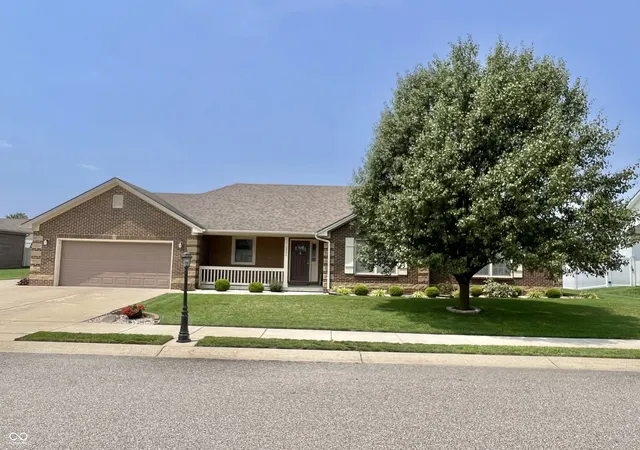
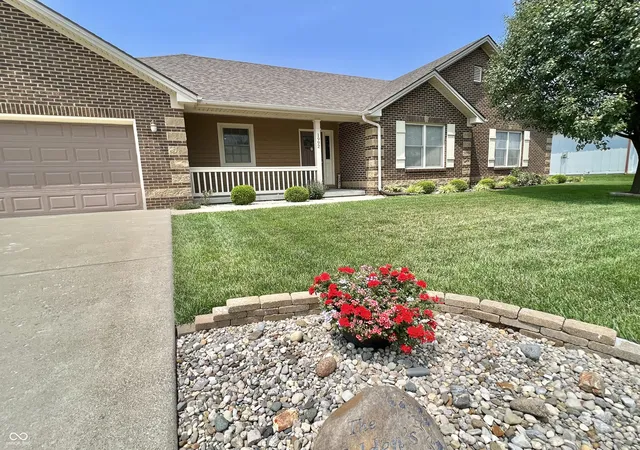
$359,900
Views: 10
Bedrooms: 3Bds
Bathrooms: 2Ba
Area: 1,828sqft
Sale Pending
MLS ID #22079531, Berkshire Hathaway Home


$189,900
Views: 7
Bedrooms: 3Bds
Bathrooms: 1Ba
Area: 1,868sqft
Single family home for sale
MLS ID #22098996, Joe Hoene Realty Team
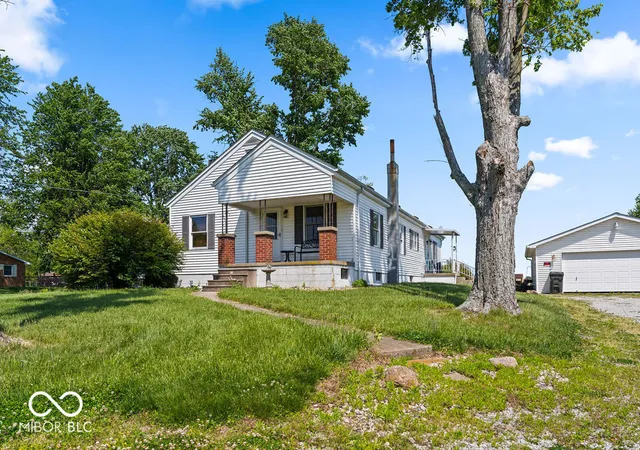
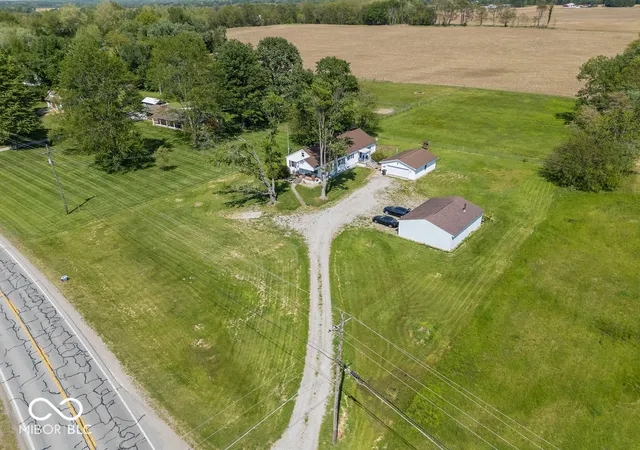
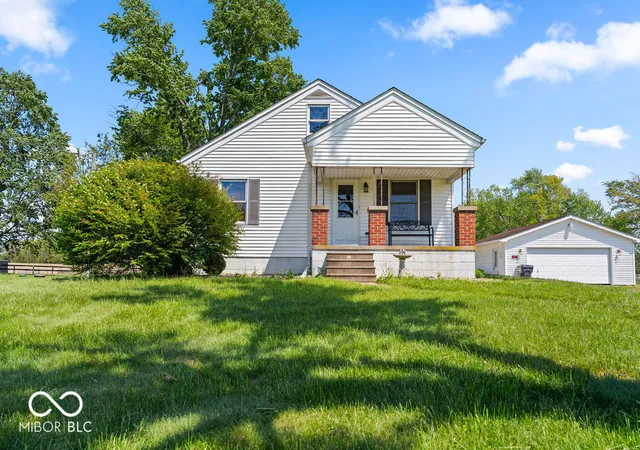
$290,000
Views: 11
Bedrooms: 3Bds
Bathrooms: 2Ba
Area: 2,520sqft
Single family home for sale
MLS ID #22099857, Exp Realty Llc
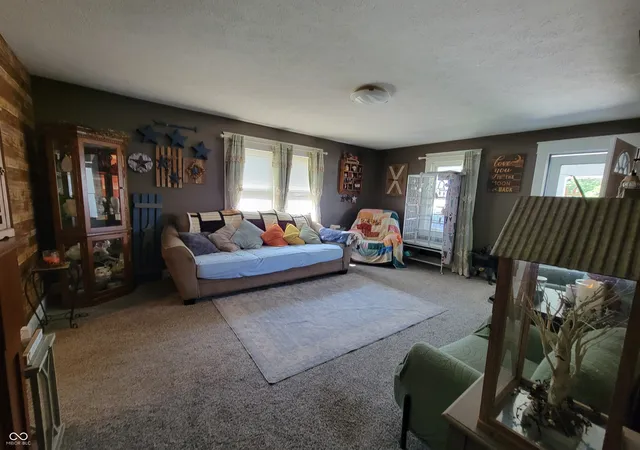
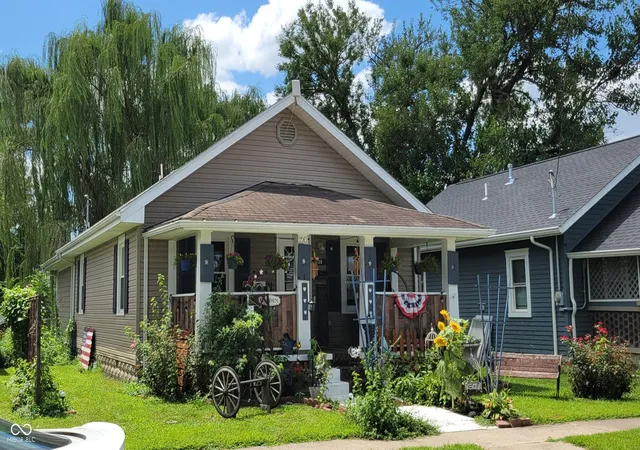
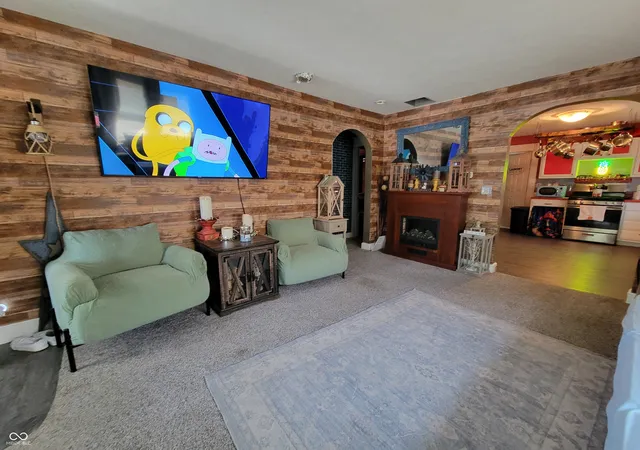
$168,000
Views: 9
Bedrooms: 3Bds
Bathrooms: 2Ba
Area: 1,252sqft
Single family home for sale
MLS ID #22120950, Berkshire Hathaway Home
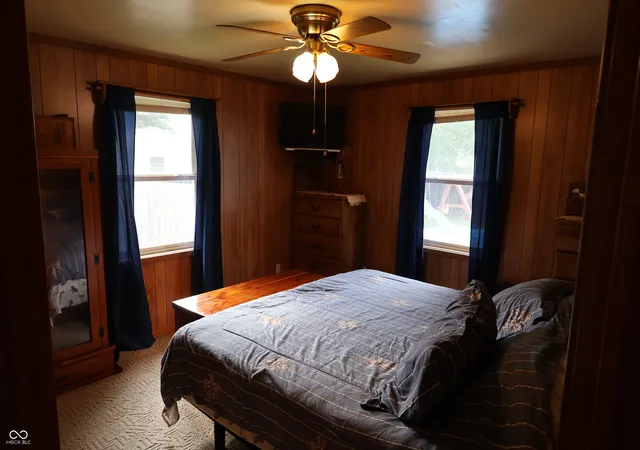
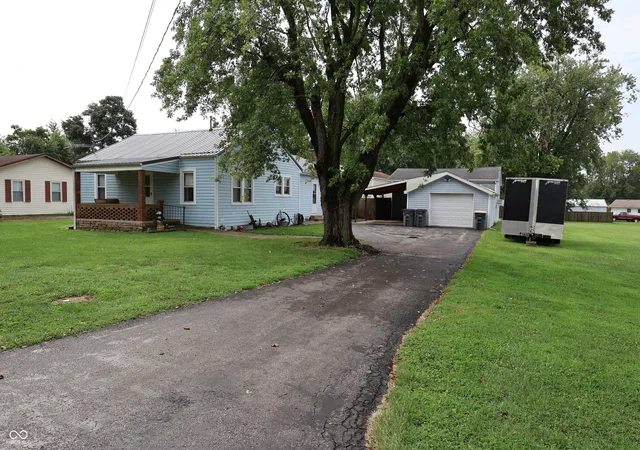
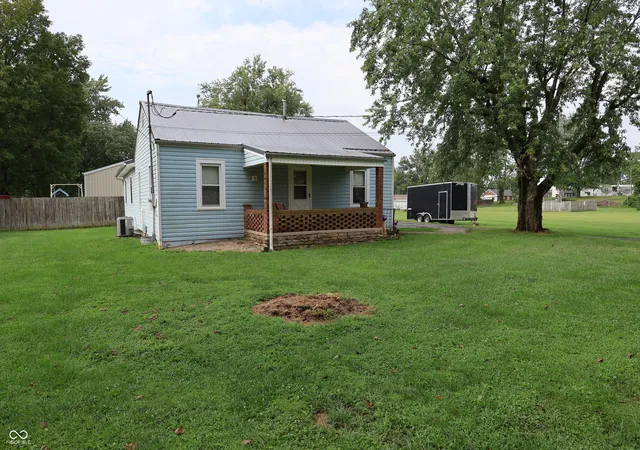
$280,000
Views: 12
Bedrooms: 3Bds
Bathrooms: 2Ba
Area: 1,504sqft
Single family home for sale
MLS ID #22119394, Carpenter, Realtors®
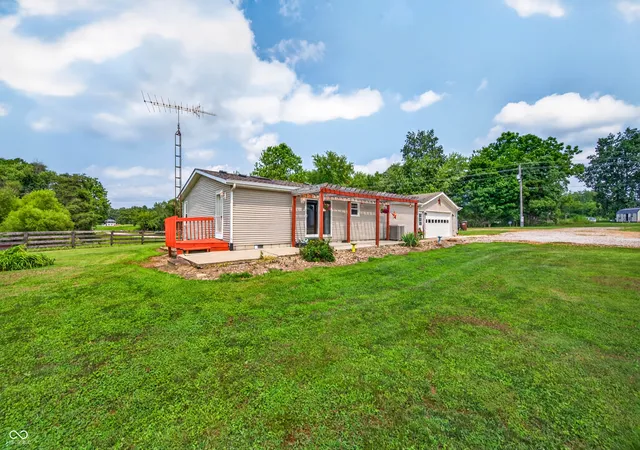
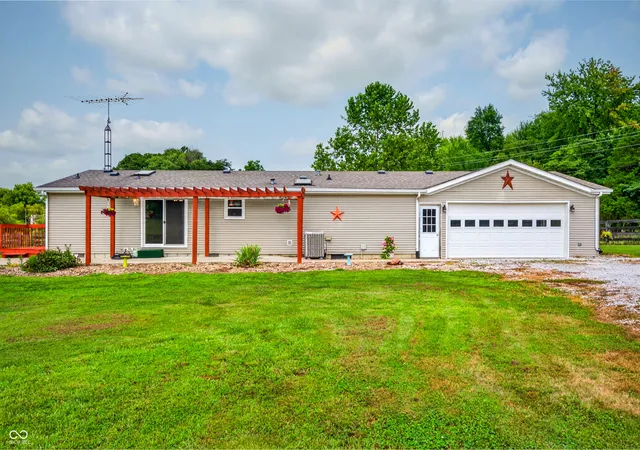
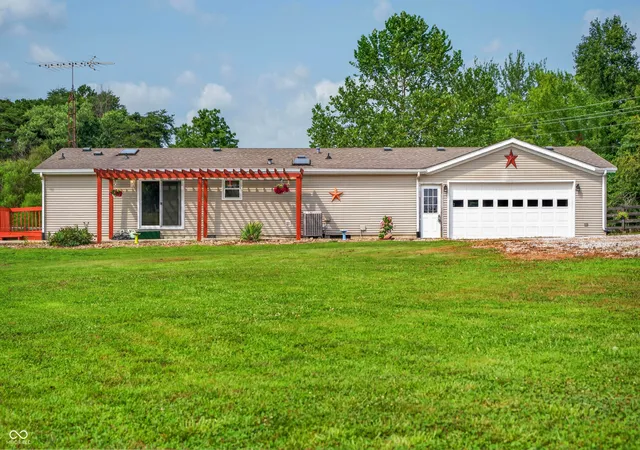
$315,000
Views: 11
Bedrooms: 3Bds
Bathrooms: 2Ba
Area: 1,344sqft
Single family home for sale
MLS ID #22116856, Keller Williams Indy Metro Partners


$599,000
Views: 3
Bedrooms: 3Bds
Bathrooms: 3Ba
Area: 4,258sqft
Single family home for sale
MLS ID #22103163, Schuler Bauer Real Estate Powe
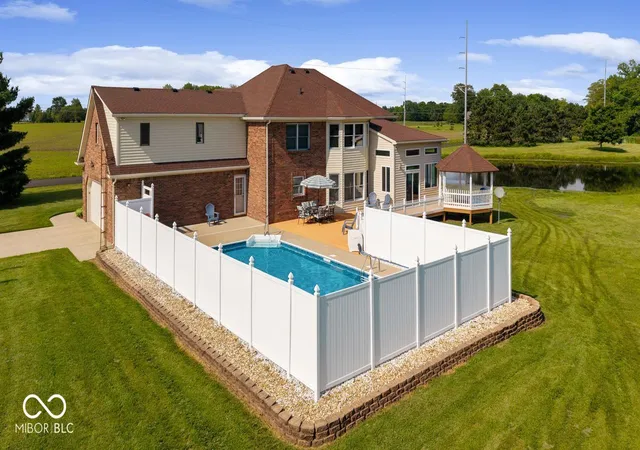
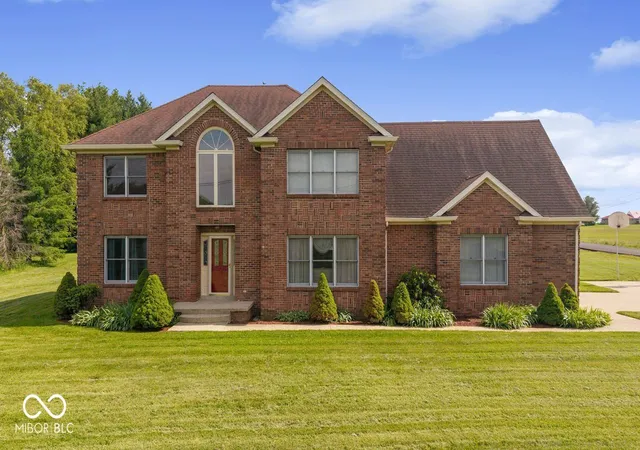
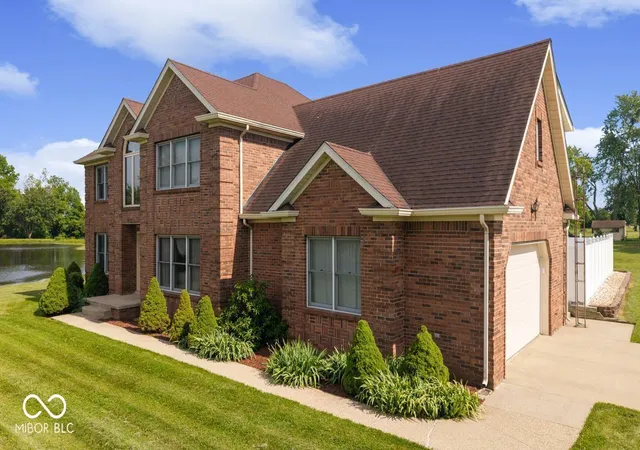
$545,000
Views: 12
Bedrooms: 3Bds
Bathrooms: 3Ba
Area: 3,193sqft
Single family home for sale
MLS ID #22105155, Millman Realty Partners, Inc.
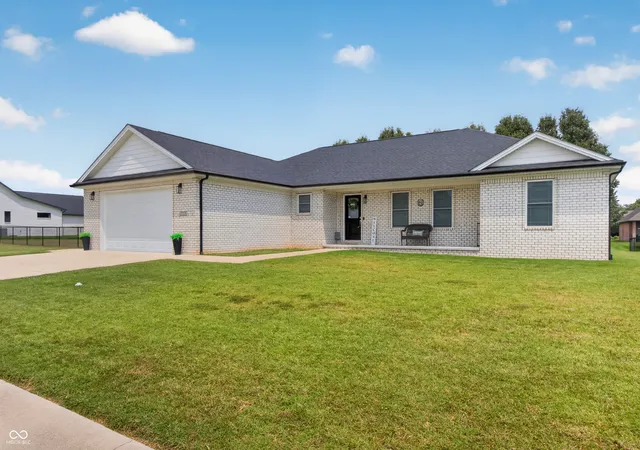
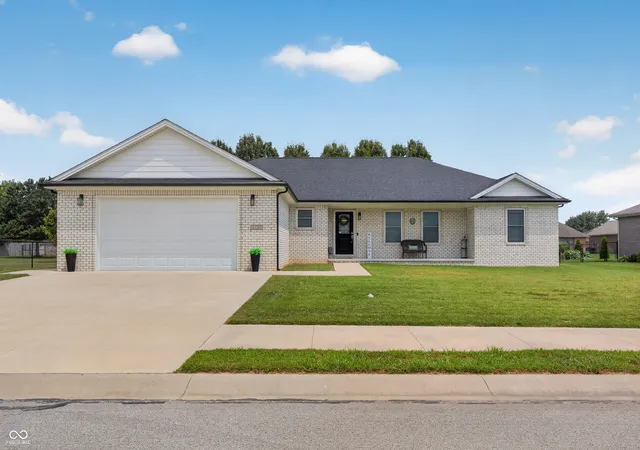
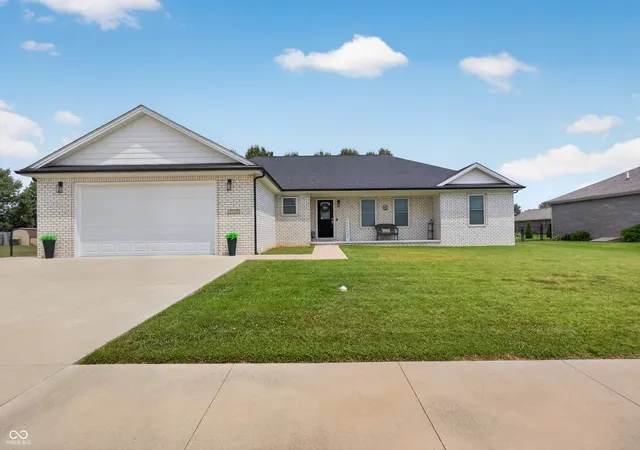
$365,000
Views: 6
Bedrooms: 3Bds
Bathrooms: 2Ba
Area: 2,318sqft
Single family home for sale
MLS ID #22116675, Century 21 Scheetz
3D Tour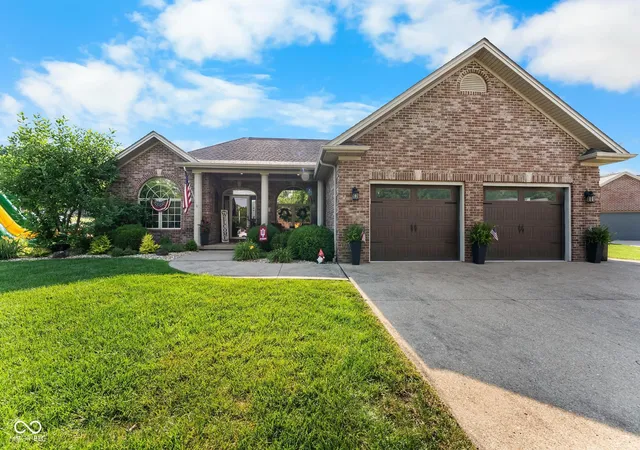
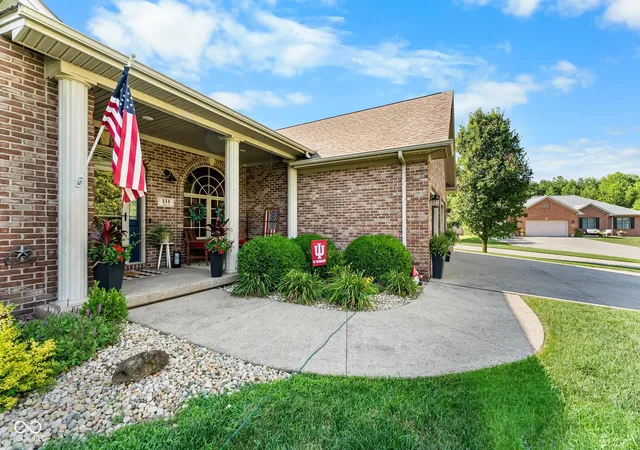
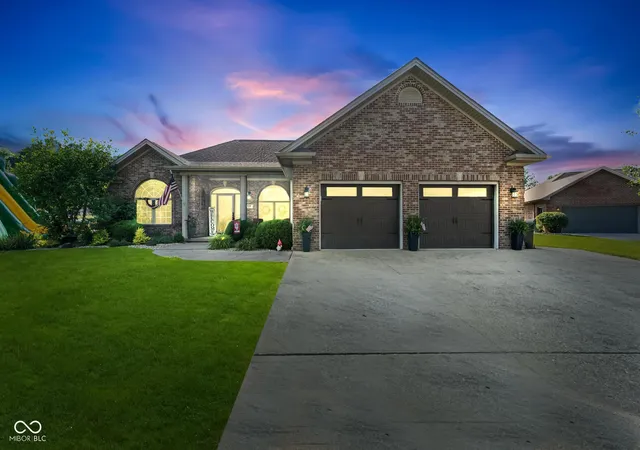
$399,900
Views: 10
Bedrooms: 3Bds
Bathrooms: 2Ba
Area: 2,351sqft
Single family home for sale
MLS ID #22112957, Schuler Bauer Real Estate Powe
3D Tour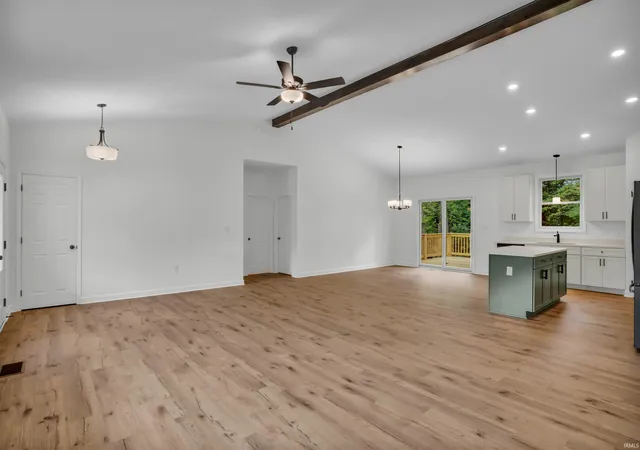
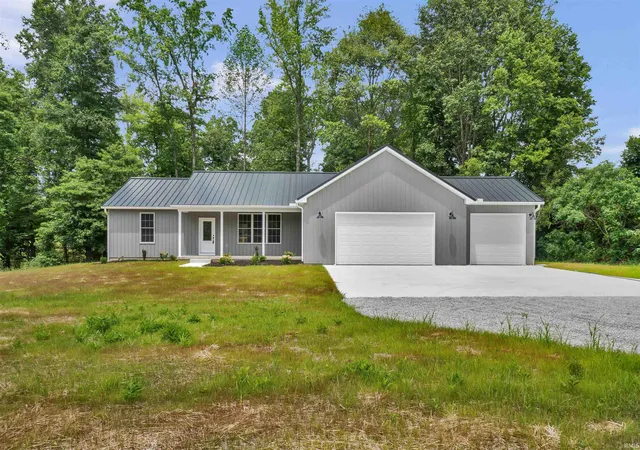
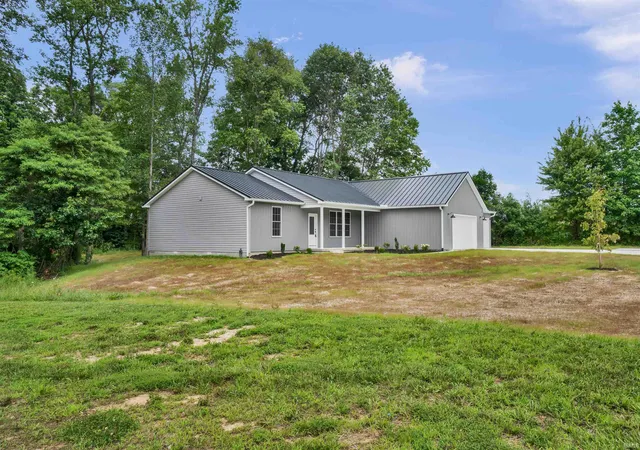

$429,900
Views: 8
Bedrooms: 3Bds
Bathrooms: 2Ba
Area: 2,156sqft
Manufactured home for sale
Re/Max Real Estate Groups
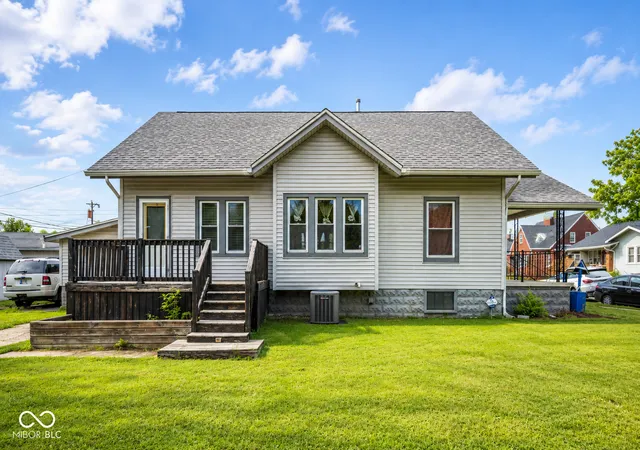
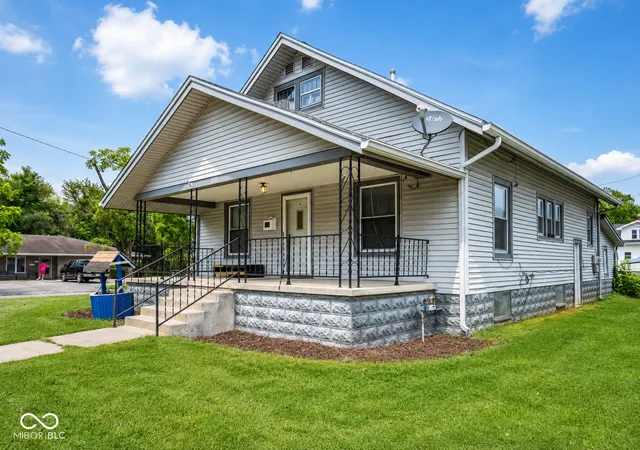
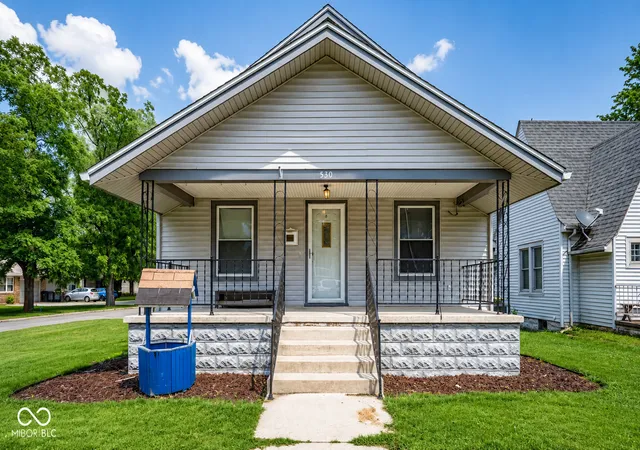
$184,900
Views: 6
Bedrooms: 4Bds
Bathrooms: 1Ba
Area: 1,929sqft
Single family home for sale
MLS ID #22113606, Berkshire Hathaway Home
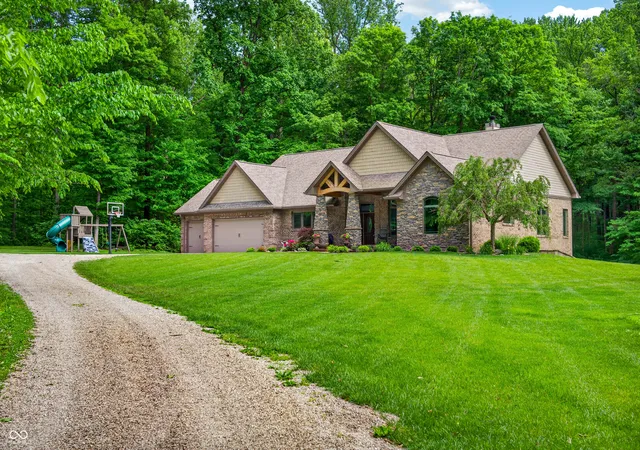
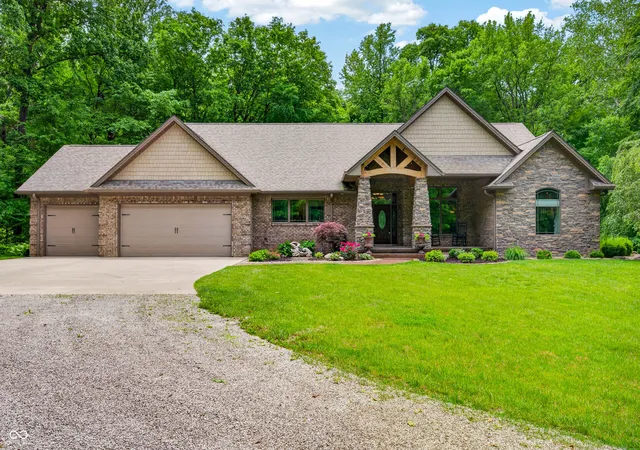
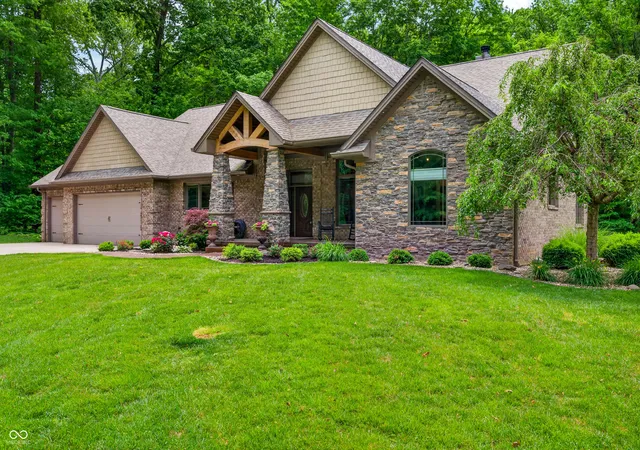
$1,145,000
Views: 5
Bedrooms: 4Bds
Bathrooms: 5Ba
Area: 4,624sqft
Single family home for sale
MLS ID #22088488, 1 Percent Lists Indiana Real Estate
3D Tour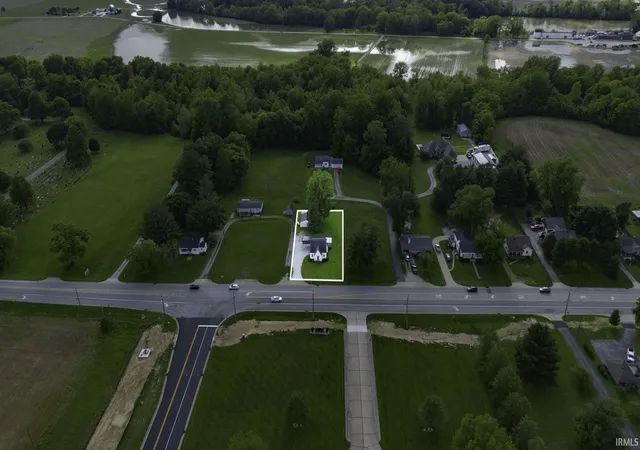
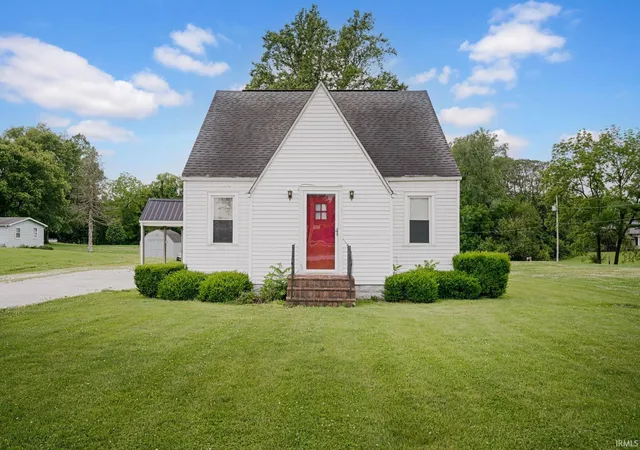
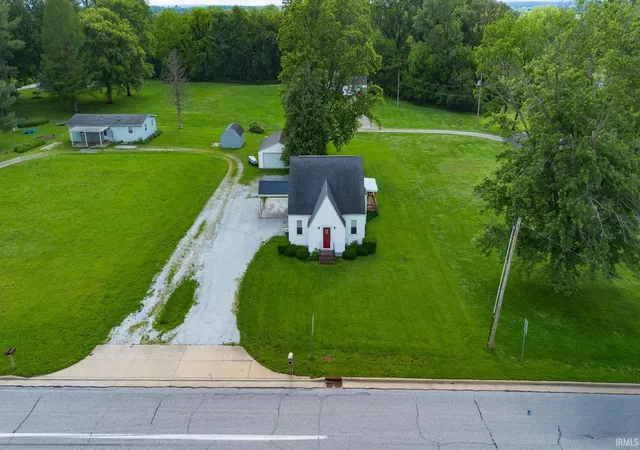
$174,900
Views: 20
Bedrooms: 2Bds
Bathrooms: 1Ba
Area: 1,409sqft
Manufactured home for sale
The Real Estate Co.


$264,900
Views: 7
Bedrooms: 2Bds
Bathrooms: 2Ba
Area: 1,566sqft
Single family home for sale
MLS ID #22099844, Homexpert, Ray Stuck & Co.
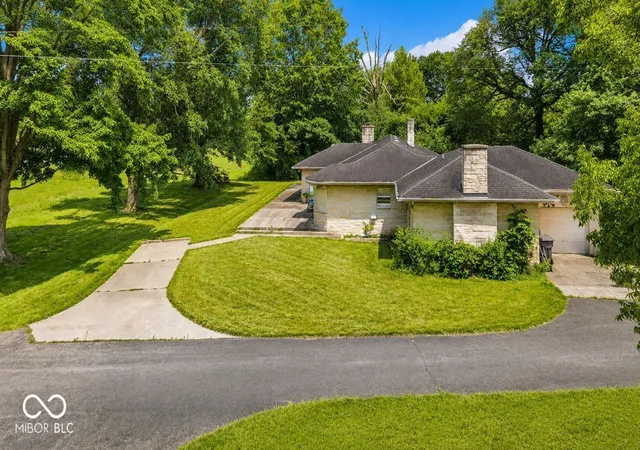
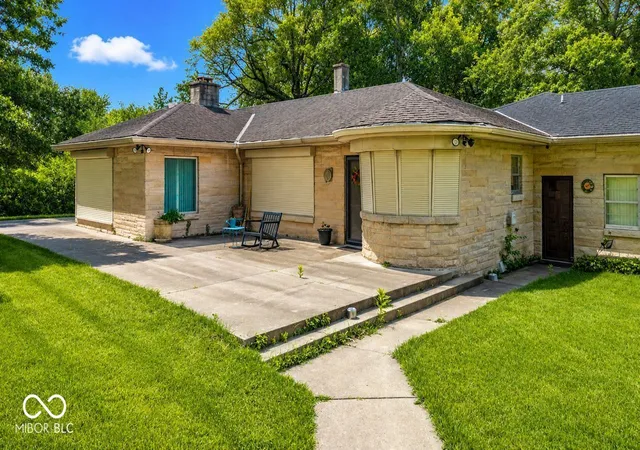
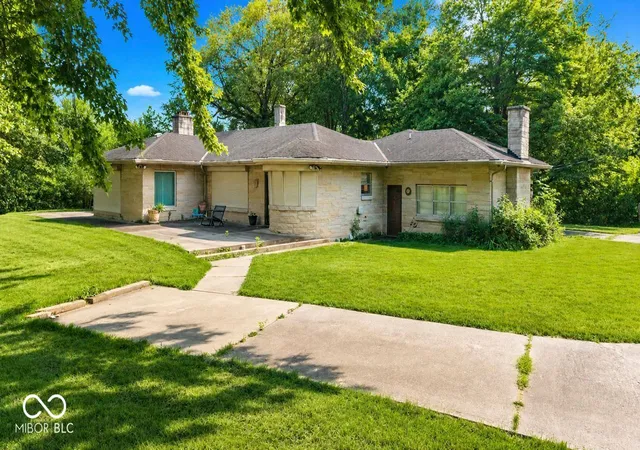
$845,000
Views: 6
Bedrooms: 3Bds
Bathrooms: 2Ba
Area: 2,317sqft
Single family home for sale
MLS ID #22077093, Millman Realty Partners, Inc.
New Construction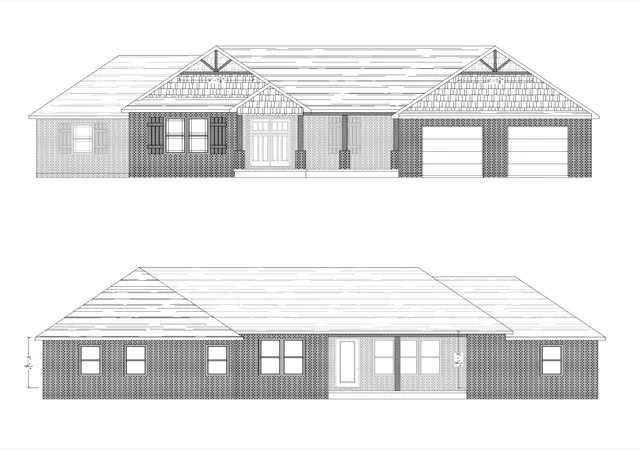


$372,610
Views: 8
Bedrooms: 3Bds
Bathrooms: 2Ba
Area: 2,048sqft
Sale Pending
MLS ID #22103111, Berkshire Hathaway Home


$109,000
Views: 8
Bedrooms: 3Bds
Bathrooms: 1Ba
Area: 1,064sqft
Sale Pending
MLS ID #22027328, Berkshire Hathaway Home
Showing 85 - 118 of 118 homes for sale in Seymour, IN
Don't miss out on new listings — and get instant email alerts!
Do Real Estate on the Go!
Find your dream home, receive real-time updates, and many more!
Seymour is a balanced market, giving buyers and sellers room to negotiate. With 1.5 months of supply and homes averaging 70 days on the market, you can make decisions without the pressure of a highly competitive market.
Balanced Market
70
41
In Mar 2026 · YoY
Current rate · YoY
30-Year Fixed
30-yr fixed rate 6.23% · Data as of Mar 2026 · Source: Houzeo Research.
View Full Seymour Market Report


118
Homes Available

$ 193,800
Median List Price

70 Days
Avg on Market
