 New Construction
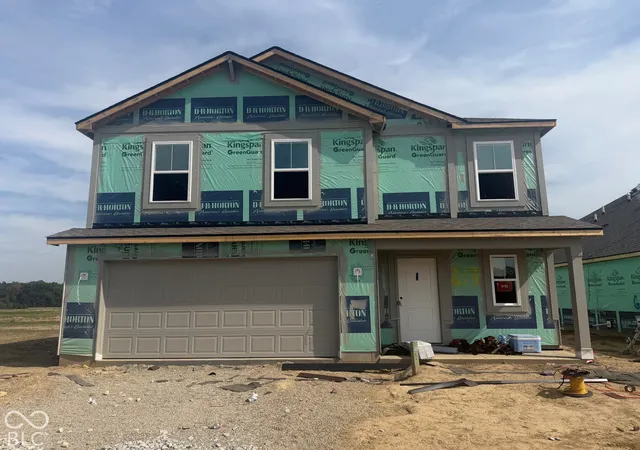

$306,275
Views: 7

Bedrooms: 4Bds
Bathrooms: 3Ba
Area: 1,839sqft
Sale Pending
MLS ID #22128770, Drh Realty Of Indiana, Llc


Do Real Estate on the Go!
New Construction$306,275
Views: 7
Bedrooms: 4Bds
Bathrooms: 3Ba
Area: 1,839sqft
Sale Pending
MLS ID #22128770, Drh Realty Of Indiana, Llc
New Construction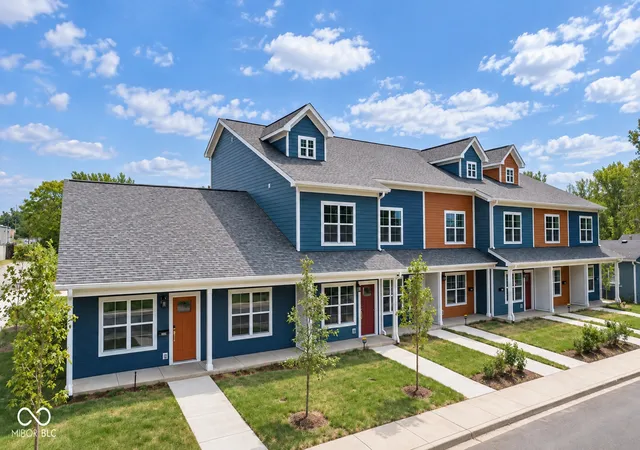
$185,000
Views: 15
Bedrooms: 3Bds
Bathrooms: 3Ba
Area: 1,685sqft
Sale Pending
MLS ID #22113542, Garnet Group
 Price Drop: $15KNew Construction
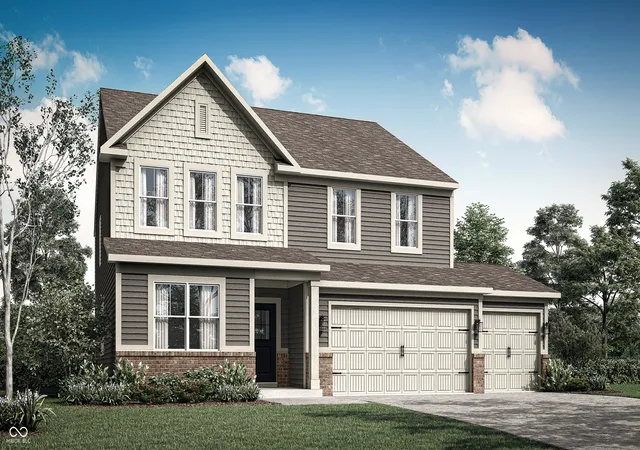
$393,020
Views: 13
Bedrooms: 5Bds
Bathrooms: 3Ba
Area: 3,054sqft
Sale Pending
MLS ID #22122802, Compass Indiana, Llc
New Construction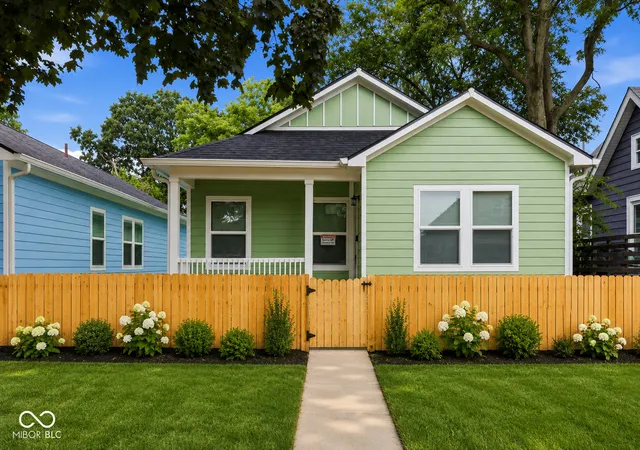
$239,900
Views: 13
Bedrooms: 3Bds
Bathrooms: 2Ba
Area: 1,520sqft
Single family home for sale
MLS ID #22113158, Exp Realty, Llc
New Construction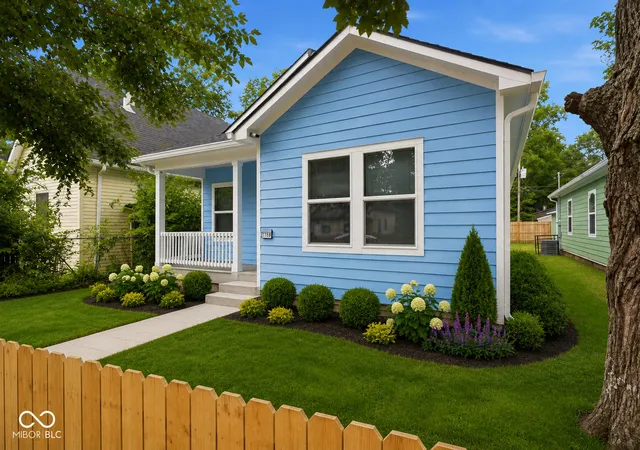
$239,900
Views: 13
Bedrooms: 3Bds
Bathrooms: 2Ba
Area: 1,520sqft
Single family home for sale
MLS ID #22113188, Exp Realty, Llc
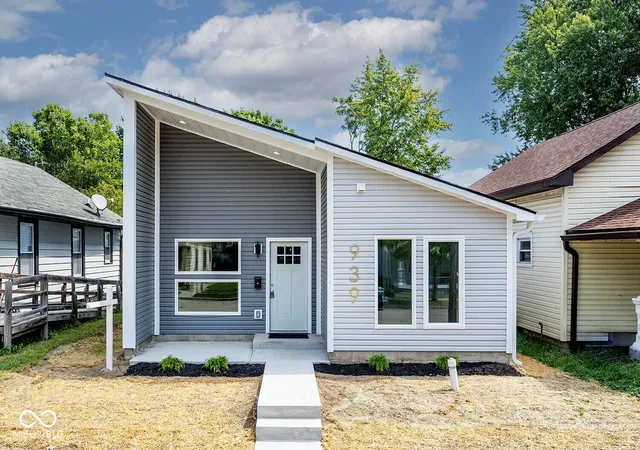
New Construction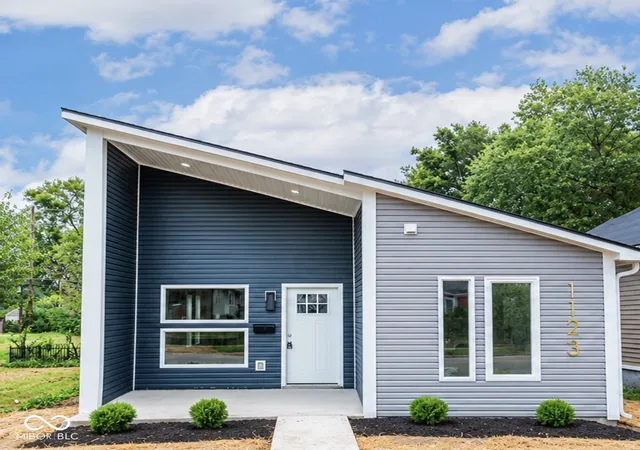
$227,400
Views: 14
Bedrooms: 3Bds
Bathrooms: 2Ba
Area: 1,406sqft
Single family home for sale
MLS ID #22126618, Garnet Group
 HotNew Construction
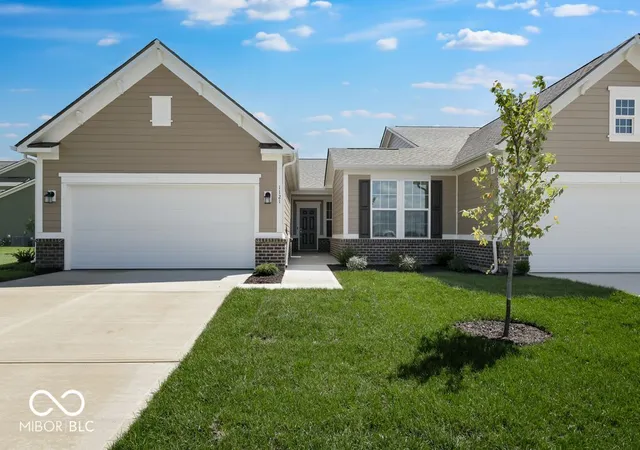
$227,400
Views: 21
Bedrooms: 3Bds
Bathrooms: 2Ba
Area: 1,406sqft
Single family home for sale
MLS ID #22123442, Garnet Group
 3D TourNew Construction
$284,500
Views: 12
Bedrooms: 2Bds
Bathrooms: 2Ba
Area: 1,605sqft
Sale Pending
MLS ID #22052928, Pyatt Builders, Llc
New Construction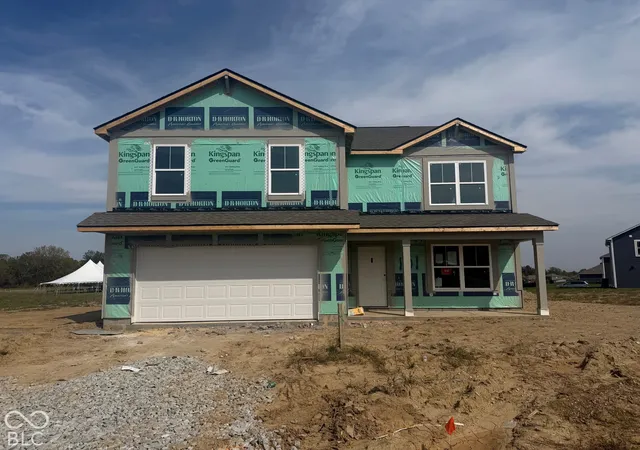
$374,500
Views: 18
Bedrooms: 5Bds
Bathrooms: 3Ba
Area: 2,600sqft
Single family home for sale
MLS ID #22126412, Drh Realty Of Indiana, Llc
New Construction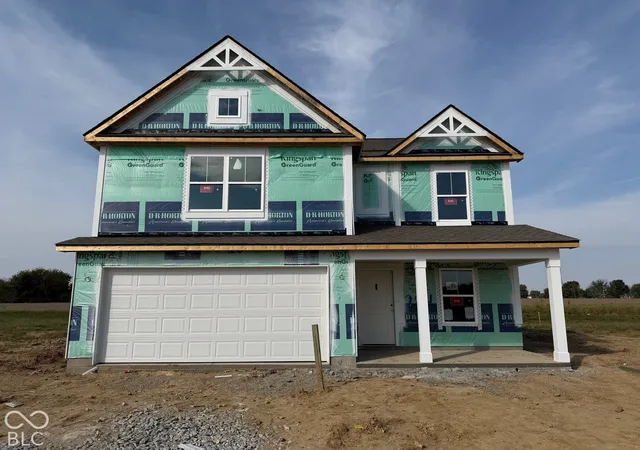
$322,070
Views: 24
Bedrooms: 4Bds
Bathrooms: 3Ba
Area: 2,053sqft
Single family home for sale
MLS ID #22126280, Drh Realty Of Indiana, Llc
New Construction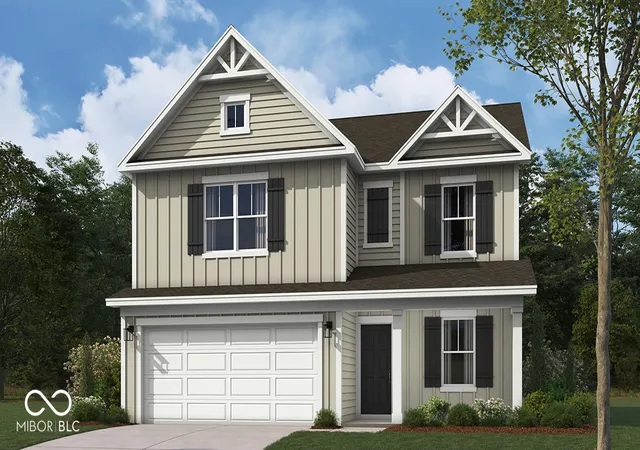
$345,026
Views: 16
Bedrooms: 4Bds
Bathrooms: 3Ba
Area: 2,053sqft
Sale Pending
MLS ID #22125371, Drh Realty Of Indiana, Llc
New Construction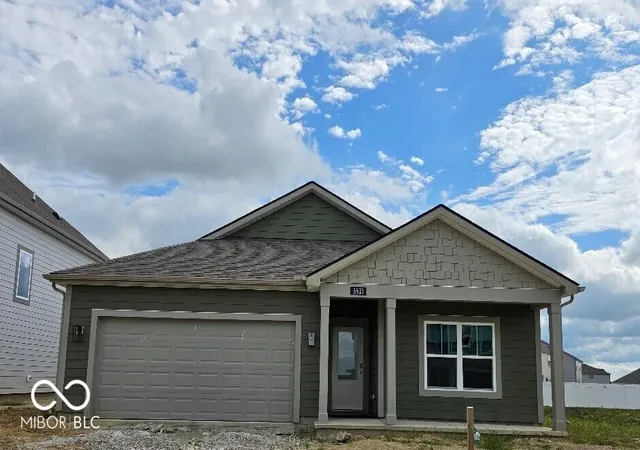
$339,900
Views: 9
Bedrooms: 4Bds
Bathrooms: 2Ba
Area: 1,771sqft
Sale Pending
MLS ID #22110672, Drh Realty Of Indiana, Llc
Price Drop: $5KNew Construction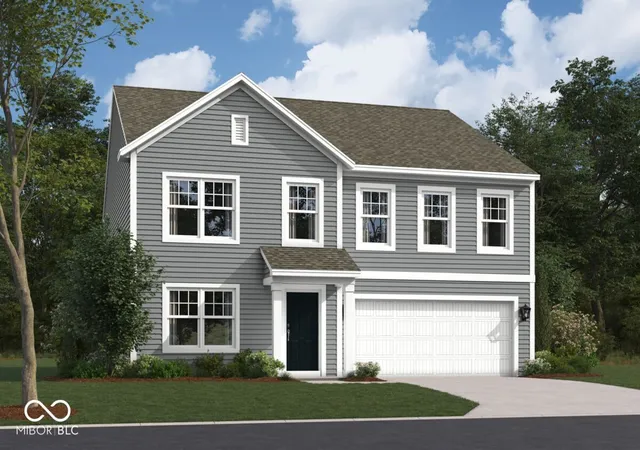
$339,990
Views: 6
Bedrooms: 4Bds
Bathrooms: 3Ba
Area: 2,622sqft
Sale Pending
MLS ID #22104218, M/I Homes Of Indiana, L.P.
Price Drop: $4.99KNew Construction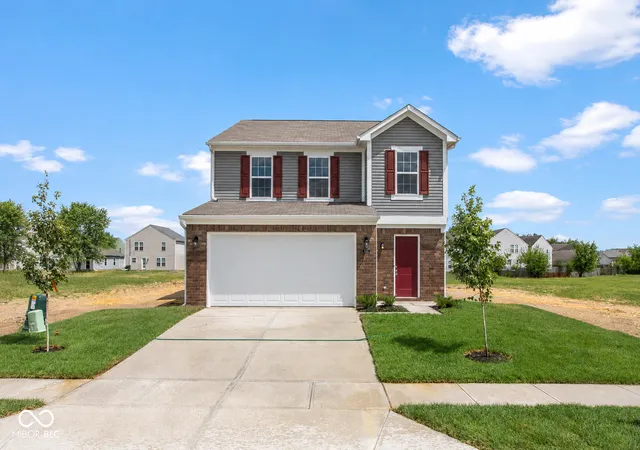
$285,000
Views: 10
Bedrooms: 4Bds
Bathrooms: 3Ba
Area: 2,196sqft
Sale Pending
MLS ID #22109596, Highgarden Real Estate
New Construction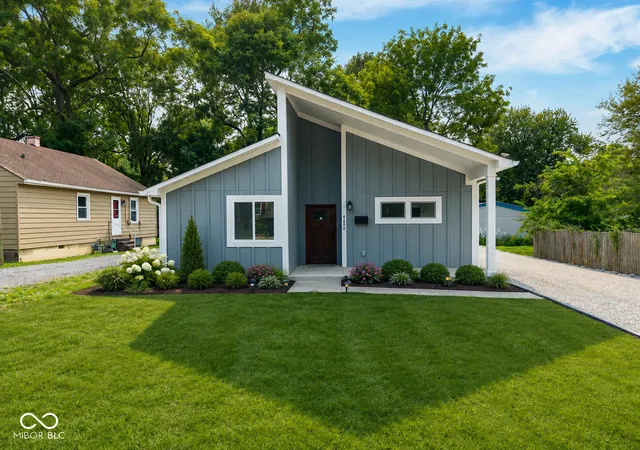
$319,000
Views: 20
Bedrooms: 3Bds
Bathrooms: 2Ba
Area: 1,412sqft
Single family home for sale
MLS ID #22119537, 1 Percent Lists Indiana Real Estate
New Construction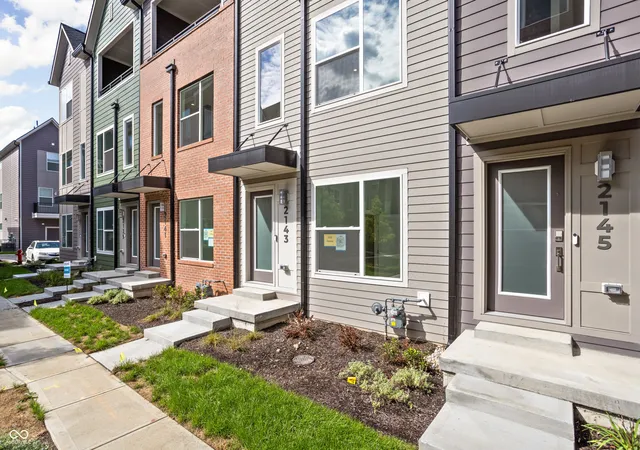
$309,900
Views: 7
Bedrooms: 2Bds
Bathrooms: 3Ba
Area: 1,300sqft
Sale Pending
MLS ID #22101551, Onyx And East, Llc
New Construction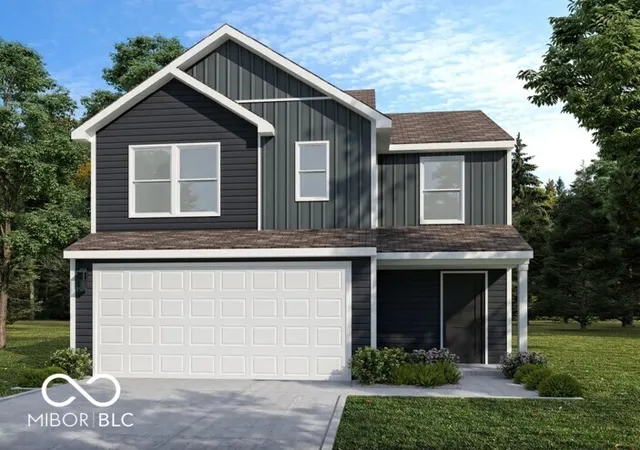
$242,995
Views: 17
Bedrooms: 3Bds
Bathrooms: 3Ba
Area: 1,430sqft
Sale Pending
MLS ID #22125377, Ridgeline Realty, Llc
New Construction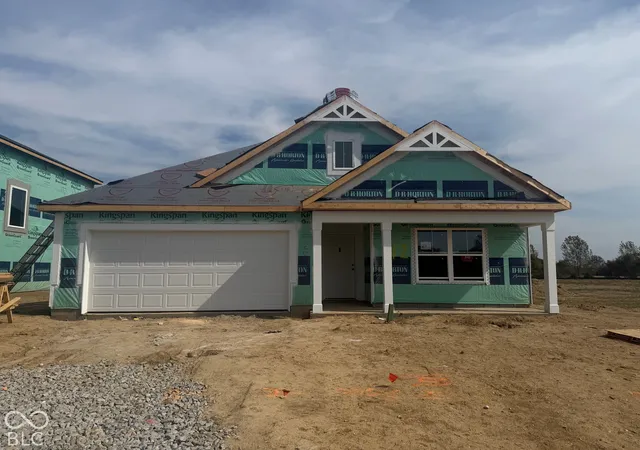
$309,980
Views: 10
Bedrooms: 4Bds
Bathrooms: 2Ba
Area: 1,771sqft
Single family home for sale
MLS ID #22128751, Drh Realty Of Indiana, Llc
Price Drop: $20KNew Construction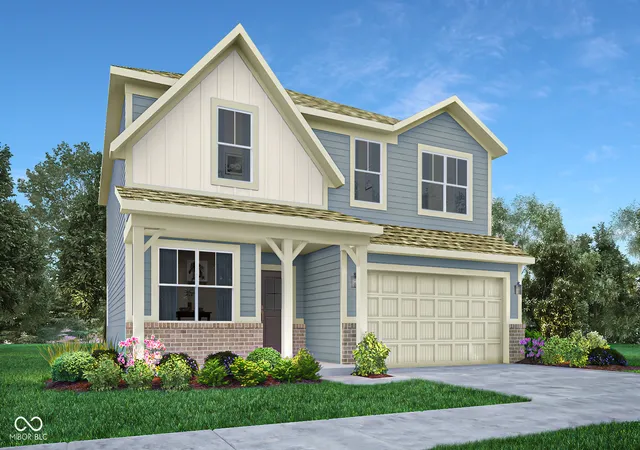
$314,995
Views: 11
Bedrooms: 5Bds
Bathrooms: 3Ba
Area: 2,422sqft
Sale Pending
MLS ID #22119633, Compass Indiana, Llc
New Construction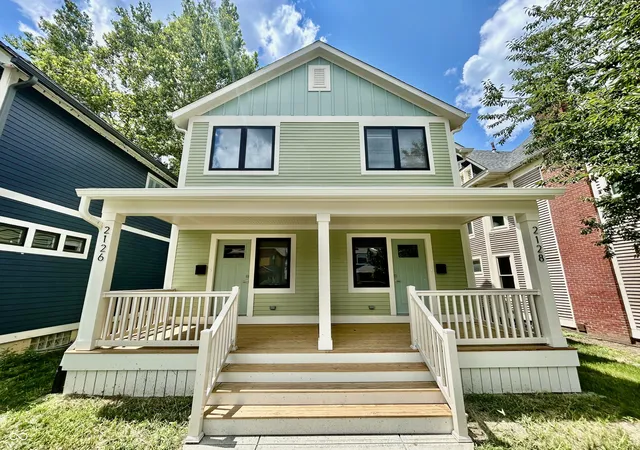
$230,000
Views: 6
Bedrooms: 4Bds
Bathrooms: 4Ba
Area: 1,998sqft
Sale Pending
MLS ID #22114948, Berkshire Hathaway Home
3D TourNew Construction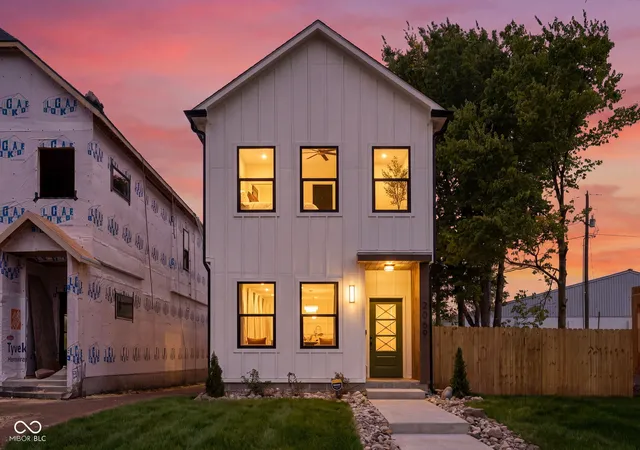
$455,000
Views: 11
Bedrooms: 3Bds
Bathrooms: 3Ba
Area: 1,812sqft
Single family home for sale
MLS ID #22124766, Trueblood Real Estate
New Construction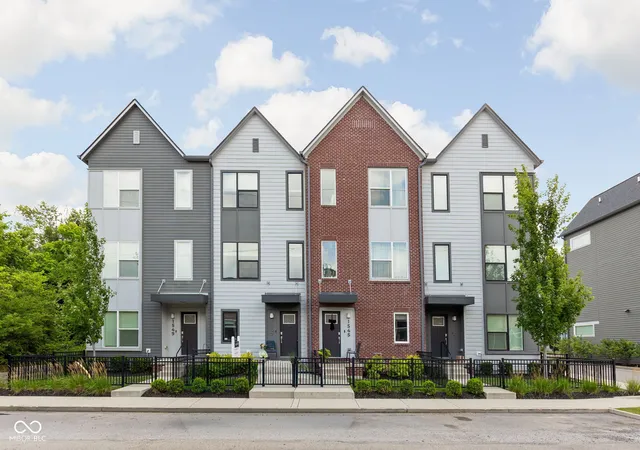
$350,000
Views: 15
Bedrooms: 2Bds
Bathrooms: 3Ba
Area: 1,369sqft
Townhouse for sale
MLS ID #22105400, @Properties
New Construction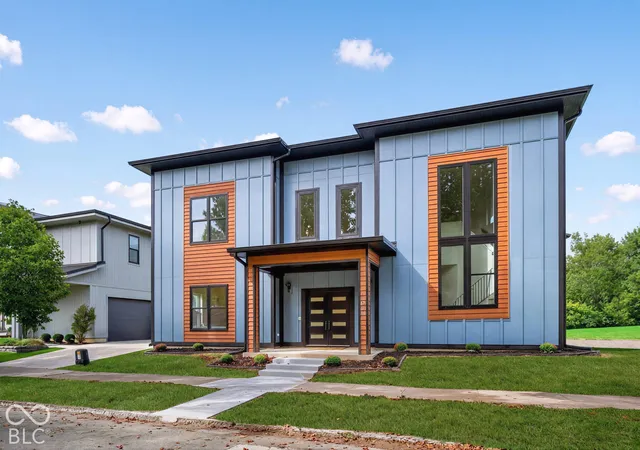
$749,900
Views: 6
Bedrooms: 4Bds
Bathrooms: 4Ba
Area: 3,280sqft
Single family home for sale
MLS ID #22128541, No Limit Real Estate, Llc
New Construction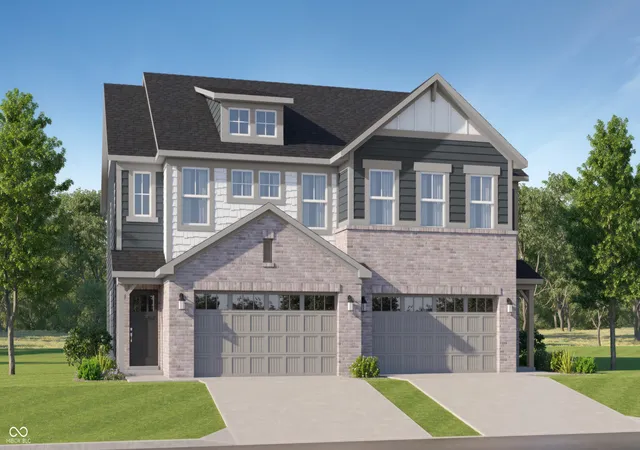
$302,995
Views: 15
Bedrooms: 3Bds
Bathrooms: 3Ba
Area: 1,814sqft
Single family home for sale
MLS ID #22126383, Compass Indiana, Llc
New Construction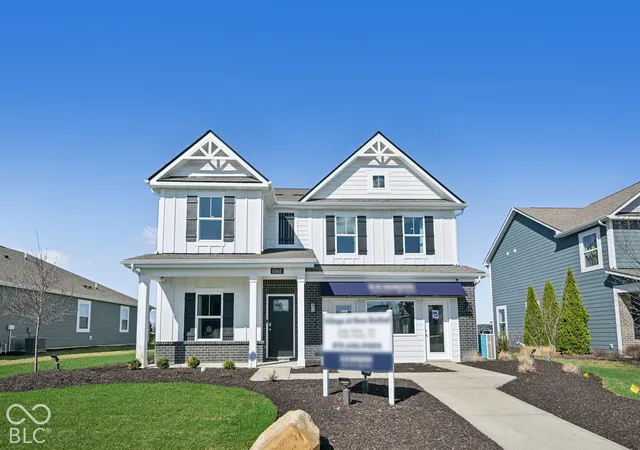
$379,900
Views: 10
Bedrooms: 4Bds
Bathrooms: 3Ba
Area: 2,346sqft
Single family home for sale
MLS ID #22128828, Drh Realty Of Indiana, Llc
New Construction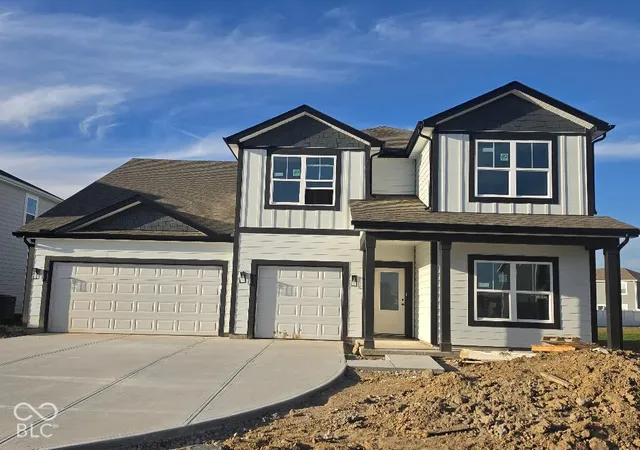
$399,900
Views: 11
Bedrooms: 4Bds
Bathrooms: 3Ba
Area: 2,851sqft
Single family home for sale
MLS ID #22120913, Drh Realty Of Indiana, Llc
New Construction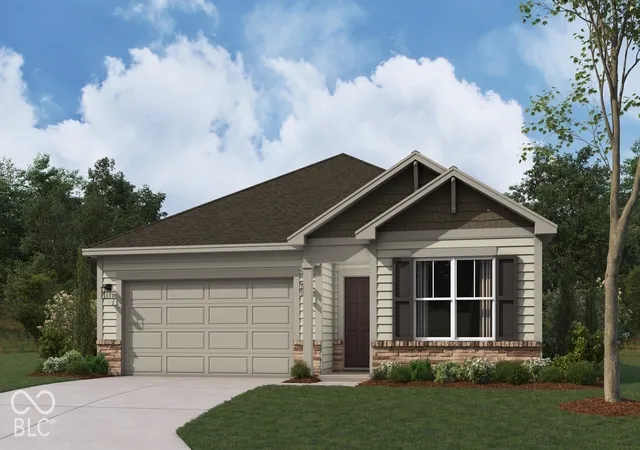
$323,350
Views: 10
Bedrooms: 3Bds
Bathrooms: 2Ba
Area: 1,601sqft
Single family home for sale
MLS ID #22128495, Drh Realty Of Indiana, Llc
New Construction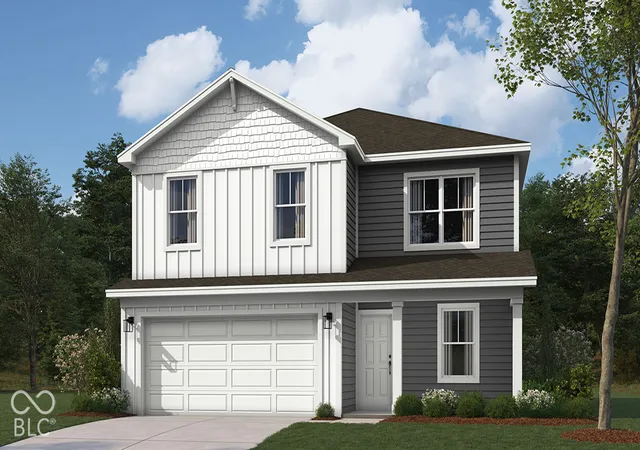
$351,531
Views: 8
Bedrooms: 4Bds
Bathrooms: 3Ba
Area: 2,053sqft
Single family home for sale
MLS ID #22128472, Drh Realty Of Indiana, Llc
New Construction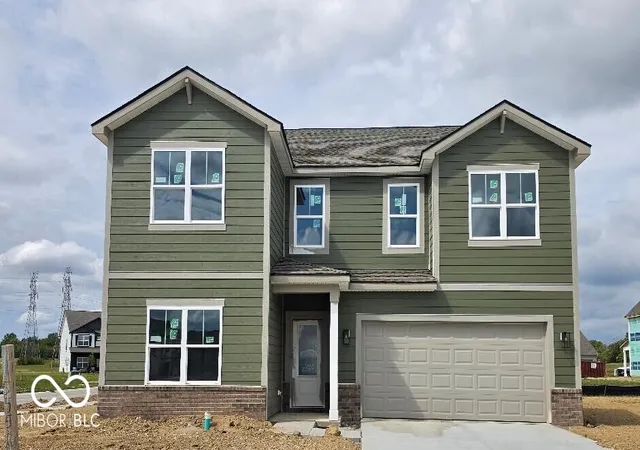
$399,900
Views: 11
Bedrooms: 5Bds
Bathrooms: 3Ba
Area: 2,904sqft
Single family home for sale
MLS ID #22116042, Drh Realty Of Indiana, Llc
New Construction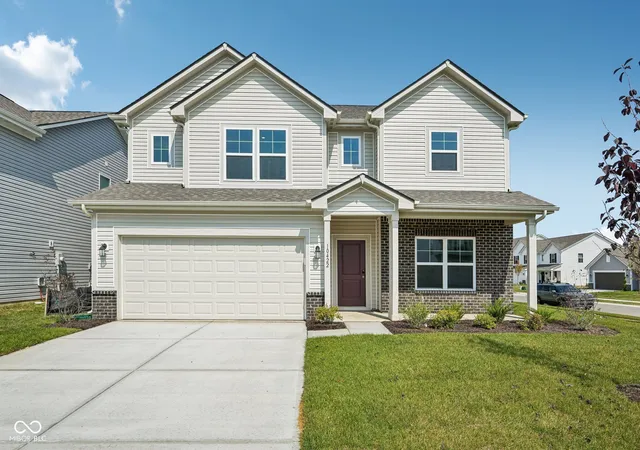
$354,995
Views: 8
Bedrooms: 5Bds
Bathrooms: 3Ba
Area: 2,999sqft
Sale Pending
MLS ID #22107861, Ridgeline Realty, Llc
3D TourNew Construction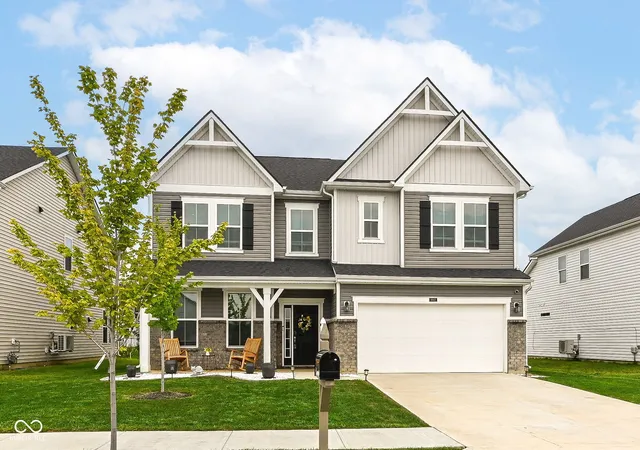
$399,000
Views: 9
Bedrooms: 5Bds
Bathrooms: 3Ba
Area: 2,922sqft
Single family home for sale
MLS ID #22116221, Keller Williams Indy Metro Ne
New Construction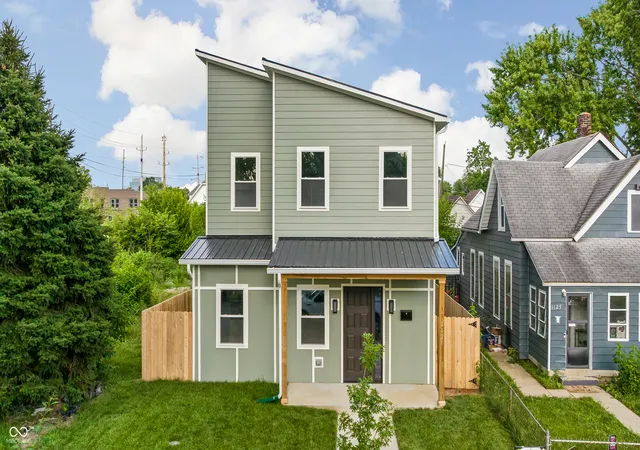
$459,900
Views: 11
Bedrooms: 3Bds
Bathrooms: 3Ba
Area: 2,750sqft
Single family home for sale
MLS ID #22114831, Empire Real Estate Llc
New Construction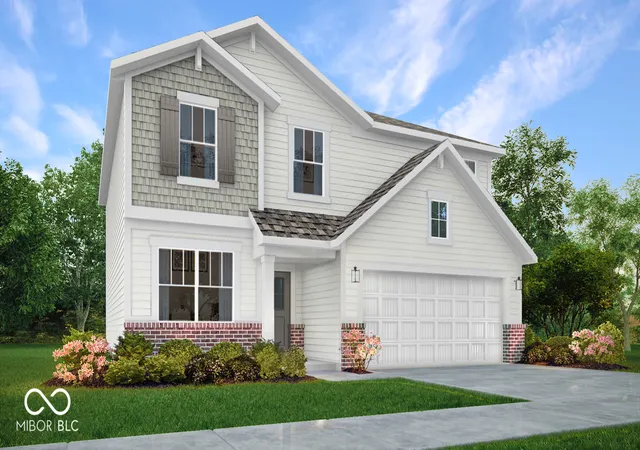
$299,195
Views: 16
Bedrooms: 5Bds
Bathrooms: 3Ba
Area: 2,427sqft
Sale Pending
MLS ID #22125170, Compass Indiana, Llc
New Construction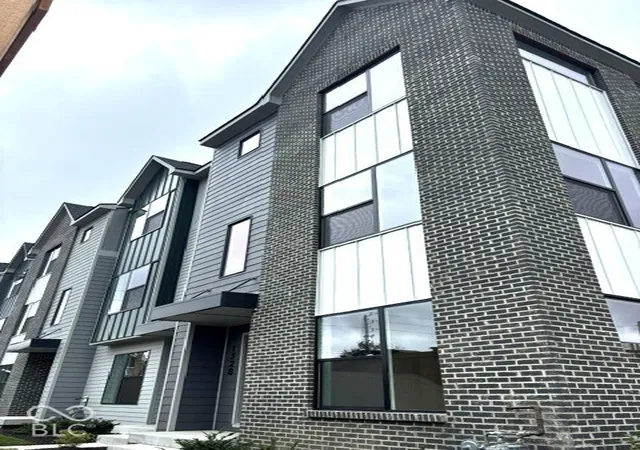
$399,900
Views: 22
Bedrooms: 2Bds
Bathrooms: 3Ba
Area: 1,876sqft
Single family home for sale
MLS ID #22124102, Onyx And East, Llc
3D TourNew Construction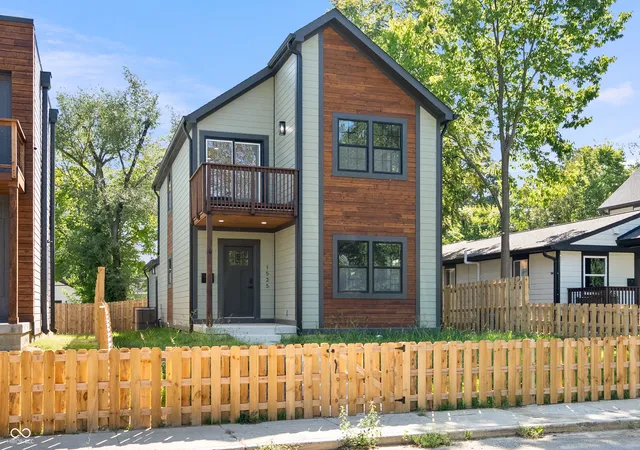
$375,000
Views: 10
Bedrooms: 3Bds
Bathrooms: 3Ba
Area: 1,808sqft
Sale Pending
MLS ID #22120141, F.C. Tucker Company
New Construction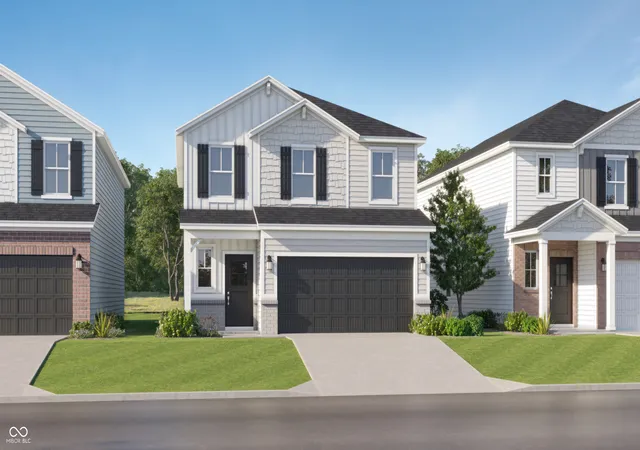
$344,995
Views: 22
Bedrooms: 4Bds
Bathrooms: 3Ba
Area: 2,170sqft
Single family home for sale
MLS ID #22125183, Compass Indiana, Llc
New Construction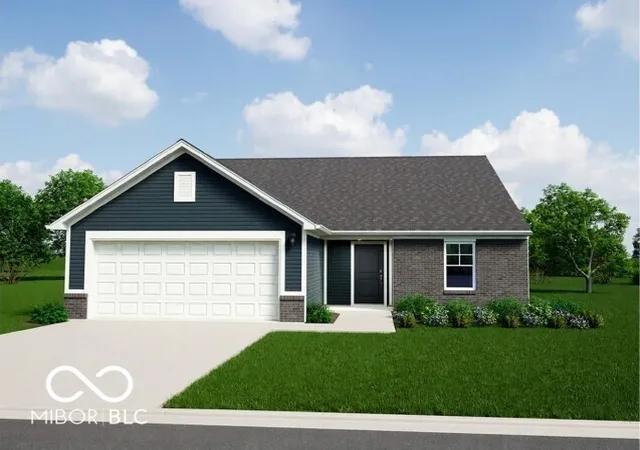
$296,995
Views: 17
Bedrooms: 3Bds
Bathrooms: 2Ba
Area: 1,613sqft
Single family home for sale
MLS ID #22127480, Ridgeline Realty, Llc
New Construction
$430,000
Views: 11
Bedrooms: 2Bds
Bathrooms: 2Ba
Area: 1,746sqft
Condo for sale
MLS ID #22081489, Keller Williams Indpls Metro N
New Construction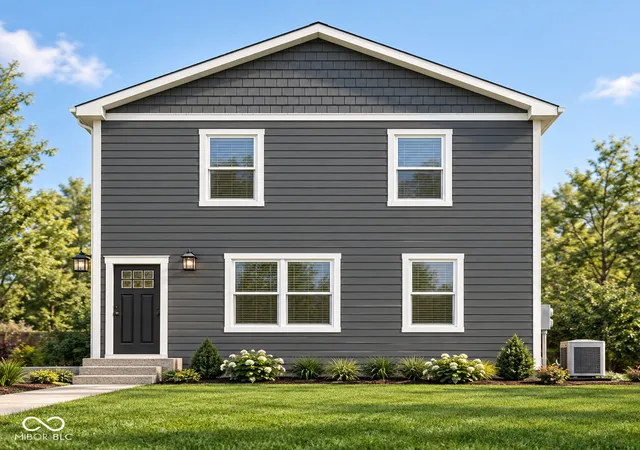
$760,000
Views: 14
Bedrooms: 2Bds
Bathrooms: 15Ba
Area: --sqft
Multi family home for sale
MLS ID #22126686, Richfield Realty Group
New Construction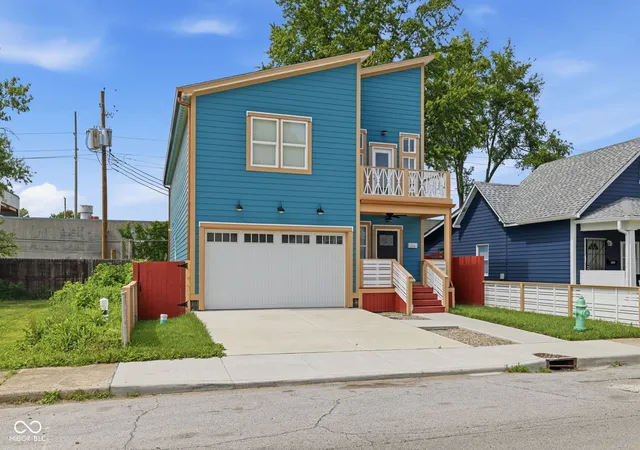
$425,000
Views: 12
Bedrooms: 4Bds
Bathrooms: 5Ba
Area: 2,900sqft
Single family home for sale
MLS ID #22105010, F.C. Tucker Company
New Construction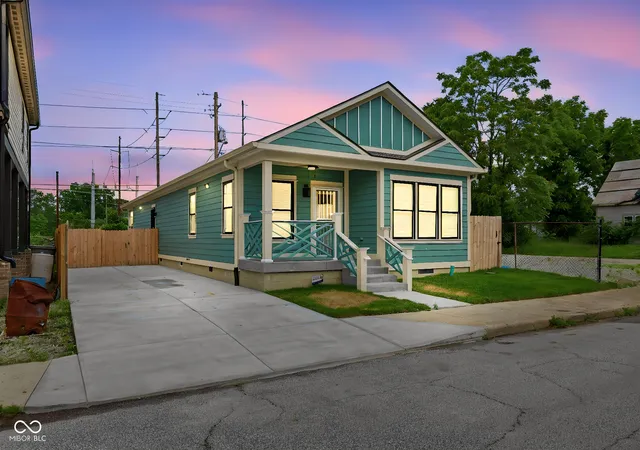
$250,000
Views: 16
Bedrooms: 3Bds
Bathrooms: 4Ba
Area: 1,830sqft
Single family home for sale
MLS ID #22107522, F.C. Tucker Company
New Construction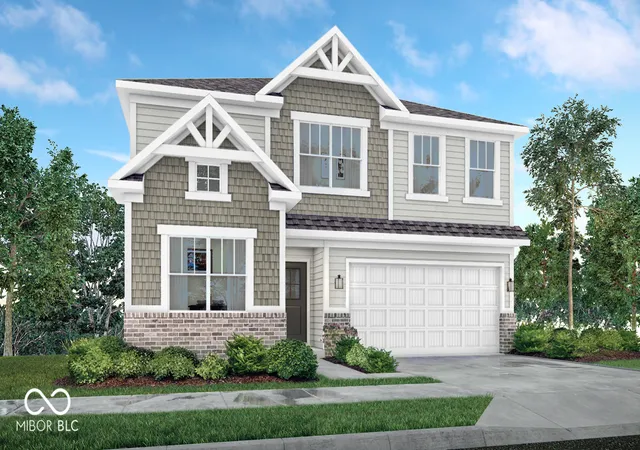
$380,995
Views: 13
Bedrooms: 5Bds
Bathrooms: 3Ba
Area: 2,856sqft
Sale Pending
MLS ID #22118194, Compass Indiana, Llc
Showing 211 - 252 of 331 homes for sale in Indianapolis, IN
Don't miss out on new listings — and get instant email alerts!
Do Real Estate on the Go!
Find your dream home, receive real-time updates, and many more!
Indianapolis is a balanced market, giving buyers and sellers room to negotiate. With 3.6 months of supply and homes averaging 60 days on the market, you can make decisions without the pressure of a highly competitive market.
Balanced Market
60
3,551
In Sep 2026 · YoY
Current rate · YoY
30-Year Fixed
30-yr fixed rate 6.23% · Data as of Sep 2026 · Source: Houzeo Research.
View Full Indianapolis Market Report


331
Homes Available

$ 257,000
Median List Price

60 Days
Avg on Market
