The 28-year-old first-time home buyer with a wishlist, a 20% down payment, and a predictable suburban dream? That American home buyer is no longer dominant.
Today’s buyer looks different: a 61-to-79-year-old Baby Boomer with decades of accumulated home equity, a repeat buyer leveraging proceeds from a previous sale, or a financially prepared buyer competing with cash.
This article combines NAR’s 2025 Buyer Profile and 2026 Generational Trends Report [1] [2], Freddie Mac mortgage data [3], U.S. Census Bureau demographics [4], and Houzeo’s own 2026 Home Buyer Report, to build a comprehensive profile of who is actually buying homes in America right now.
The picture is surprising. The housing industry spent decades optimizing for yesterday’s buyer. The data shows tomorrow’s buyer is already here.
7 Findings That Define Today’s Home Buyer
- Baby Boomers (ages 61–79) account for 42% of all home purchases, more than Millennials (26%) and Gen Z (4%) combined.[1]
- Millennials earn the most ($132,700 median household income) yet are losing first-time buyer share; down from 71% to 60% in a single year.[1]
- First-time buyers have dropped to 21% of the market, the lowest share since NAR began tracking in 1981. Before 2008, first-timers were ~40% of the market.[2]
- The median first-time buyer is now 40 years old, up from 29 in 1981 and 33 just five years ago.[2]
- 56% of offers submitted by buyers on Houzeo are all-cash, suggesting an investor-heavy and equity-rich buyer base that has fundamentally different needs than mortgage-dependent first-timers.[8]
- 71.5% of property-type selections on Houzeo go to non-single-family housing, meaning the buyer profile isn’t just older and richer; it’s more flexible.[8]
- 43% buyers are looking for properties online, even before contacting an agent, visiting an open house, or calling a lender.[2]
The Generational Inversion: Boomers Lead, Millennials Stall, Gen Z Waits
For the first time in recent years, buyers aged 61–79 represent the largest generational share of home purchases. NAR’s 2026 Home Buyers and Sellers Generational Trends Report [1] lays out the breakdown:
| Generation | Age Range | Share of Purchases | Year-over-Year Change |
| Baby Boomers | 61–79 | 42% | Unchanged |
| Millennials | 27–45 | 26% | Down from 29% |
| Gen X | 46–60 | 25% | Up from 24% |
| Gen Z | 18–26 | 4% | Up from 3% |
| Silent Generation | 80–100 | 4% | Unchanged |
Baby Boomers overtook Millennials as the largest buyer cohort in 2025 and have held that position since. This isn’t because Boomers are buying more, it’s because everyone else is buying less.
The combination of accumulated home equity, downsizing proceeds, and the ability to make cash offers gives Boomers structural advantages that younger generations cannot match in the era of 7% mortgage rates.
Millennials, despite being the largest U.S. population cohort and earning the highest median household income of any generation at $132,700 [1], are losing share. The culprit isn’t desire, it’s math.
With the median existing-home price at $434,100 and the 30-year fixed rate at 6.95%, the monthly carrying cost for a mortgage buyer has increased significantly since 2021. [1] [3]
Gen Z’s 4% share is growing (up from 3%), but the absolute numbers remain small. NAHB’s 2026 Outlook notes that Gen Z buyers are “enthusiastic about homeownership but have a very low homeownership rate, constrained by affordability.” [5]
The First-Time Home Buyer Crisis: 21% and Falling
The most consequential number in American’s new home buyer profile report may be this one: first-time buyers now represent just 21% of all home purchases. That’s the lowest share since NAR began tracking in 1981.
Before 2008, first-time buyers typically made up about 40% of the market. [2] They were the foundation of the housing ladder: starter-home buyers who would eventually sell and upgrade, creating transactions at every price tier. That foundation has eroded dramatically:
- The median age of a first-time buyer hit 40 in 2025, up from 29 in 1981, 31 in 2015, and 33 in 2020. The seven-year jump in the last decade alone reflects the compounding effect of higher prices, higher rates, and student debt. [2]
- Among Younger Millennials (ages 27–35), 60% of buyers were first-timers, down from 71% just one year prior. That 11-point single-year drop is one of the steepest declines NAR has recorded. [1]
- Gen X was the only generation where the first-time buyer share increased, rising 1 percentage point to 21%. [1]
- Repeat buyers now constitute 79% of all home purchases, often arriving with larger down payments, home equity from prior sales, and all-cash offer capabilities. [2]
Why the American Home Buyer Changed: 5 Forces Reshaping Housing
The American home buyer did not change overnight.
The profile of today’s home buyer is the result of several housing market forces that have reshaped affordability, mobility, and purchasing power over the last five years.
1. Higher Mortgage Rates
The largest shift came from the rapid increase in mortgage rates after 2021.
During the pandemic, millions of buyers locked in historically low mortgage rates below 4%. By 2026, the average 30-year fixed mortgage rate remained near 7%, significantly increasing the monthly cost of financing a home. [9]
For a buyer purchasing a median-priced home, the difference between a 3% mortgage rate and a nearly 7% mortgage rate can translate into hundreds of dollars in additional monthly payments. This reduced purchasing power particularly affected first-time buyers, who typically have smaller down payments and less to non-existential home equity.
Freddie Mac data shows mortgage rates rose sharply from pandemic-era lows, while NAR data shows first-time buyers have fallen to a record-low share of transactions. [3]
Higher rates did not eliminate demand for homeownership, they changed who could compete. Buyers with existing equity, larger down payments, or cash reserves gained an advantage.
2. The Starter Home Shortage Reduced Entry Points
For decades, first-time buyers entered the market through smaller, lower-priced homes. That pathway has become increasingly limited.
NAHB research has highlighted the declining availability of affordable entry-level housing, while builders have faced higher costs for land, labor, materials, and regulation. [5]
The result is a mismatch:
- Younger buyers need lower-priced homes.
- Builders face difficulty producing homes at those price points.
- Existing homeowners are staying longer because of mortgage lock-in.
This has slowed the traditional housing ladder, where first-time buyers purchase starter homes, later upgrade, and create inventory for the next generation.
3. Existing Home Equity Became a Competitive Advantage
The current market increasingly rewards buyers who already own property.
Repeat buyers often enter the market with:
- proceeds from a previous home sale
- accumulated appreciation
- larger down payments
- the ability to compete with cash offers
According to NAR, repeat buyers represent the majority of transactions, while first-time buyers have declined to historic lows. [2]
Home equity explains why more Baby Boomers are buying homes in 2026 despite lower current employment income compared to younger generations.
4. Remote Work Expanded the Definition of “Where to Live”
The modern American home buyer is increasingly choosing location based on lifestyle, affordability, and flexibility rather than job proximity.
Migration toward states such as Florida, Texas, North Carolina, Tennessee, and South Carolina reflects broader shifts toward:
- lower housing costs
- warmer climates
- tax considerations
- lifestyle preferences
Census migration data [4] and Redfin [7] relocation research show that affordability remains a major factor driving interstate moves. For many buyers, the search process now begins with: “Which market fits my life?” before: “Which home is available near me?”
5. The Digital Marketplace Changed Buyer Behavior
The final force is technological.
Home buyers increasingly complete the early stages of purchasing online:
- discovering markets
- comparing listings
- tracking price changes
- saving homes
- monitoring inventory
Houzeo’s buyer behavior data shows[8] that today’s buyer does not simply browse listings; they actively monitor the market through alerts, saved searches, and property tracking.
The result is a more informed buyer who often reaches agents later in the decision process, after narrowing their preferences. The rise of a powerful home shopper will only increase as AI-based home search becomes more prominent.
How Buyers Finance: Income, Down Payments, and the Cash Divide
The way buyers pay for homes reveals the market’s bifurcation more clearly than any other metric.
Income by Generation
Millennials are the highest-earning buyer cohort at a median household income of $132,700. However, high income hasn’t translated into proportional purchasing power. [1]
Gen X follows at approximately $126,000, with Baby Boomers at approximately $102,000. Boomers compensate for lower current income with accumulated equity: many are buying their next home with proceeds from selling their current one. [1]
Down Payments
The national average down payment in 2026 is 12.8% of the purchase price[10], or about $54,600 on the median $420,000 home. But this average masks a significant gap:
- First-time buyers: 10% median down payment ($42,000 on $420K) [2]
- Repeat buyers: 23% ($96,600 on $420K) [2]
- By age: buyers aged 26-34 put down about 10%, those 35–44 put down 14%, and 60–69 average 28% [1]
- 33% of Younger Millennials received down payment help in the form of a gift or loan from family; the highest rate of any generation. [1]
The 20% down payment benchmark is largely a myth: only about 26% of all buyers reach that threshold. Programs like FHA (3.5% down with 580+ credit) and Conventional 97 (3% down) remain accessible for many qualified first-timers. [11] [12]
The Cash Offer Reality
One of the most striking findings from Houzeo’s data is the share of all-cash offers.
Of the 501 offers that buyers submitted on Houzeo between January and September 2026, 56% were all-cash (261) versus 44% financed by mortgage (206). [8] This suggests a buyer segment with greater liquidity, not necessarily an investor-heavy or equity-rich buyer base.
This ratio exceeds the national average of approximately 26–32% cash purchases tracked by NAR. The higher cash share may reflect a buyer base with greater liquidity and investment intent. That’s a pattern supported by favorites collection names like “fix and flip,” “wholesale real estate,” and “sold comps,” which suggest a meaningful investor presence alongside traditional home buyers.
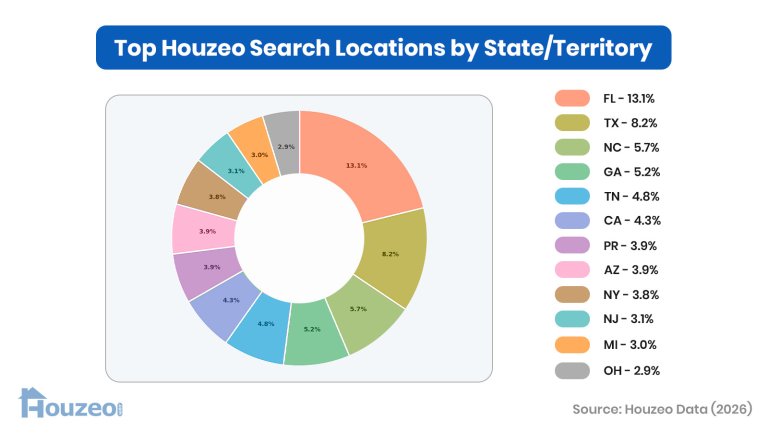
Where Today’s Buyers Are Looking
The 2026 buyer isn’t just different in age and wealth; they’re different in geography.
The old model of “find a house in your city” has been replaced by “find a city that fits your life, then find a house.”
Top states by combined Houzeo activity (searches + inquiries, Jan–Sep 2026)[8]:
| Rank | State | Searches | Inquiries | Total |
| 1 | Florida | 104 | 707 | 811 |
| 2 | Texas | 65 | 332 | 397 |
| 3 | New York | 30 | 248 | 278 |
| 4 | California | 34 | 236 | 270 |
| 5 | Georgia | 41 | 226 | 267 |
| 6 | North Carolina | 45 | 210 | 255 |
| 7 | Ohio | 23 | 204 | 227 |
| 8 | New Jersey | 25 | 201 | 226 |
| 9 | Michigan | 21 | 168 | 189 |
| 10 | Pennsylvania | 19 | 168 | 187 |
Florida dominates with 811 combined buyer actions, nearly double the next state.
But the interesting pattern is below the top line: Puerto Rico ranks 12th with 162 combined actions (31 searches, 131 inquiries) from 25+ unique buyers, outpacing states like Alabama, Illinois, and Wisconsin. Its share is accelerating in Q3 2026. [8]
This geographic distribution aligns with national migration trends. U.S. Census Bureau data shows North Carolina leading the nation in net domestic migration (+84,064 for 2024–2025), followed by South Carolina (+66,600), Texas (+67,300), and Tennessee (+51,700). [4]
NAR found that 45% of interstate movers cite affordability as their primary reason for relocating. This number is up from 38% in 2022. [2]
Houzeo’s favorites data[8] adds behavioral texture to the geographic picture. Collection names like “Born in Florida,” “Why Tennessee,” “Texas(buying)🏠,” and “nueva vida” reveal buyers framing relocation as a lifestyle and identity decision. It’s not just a financial calculation.
What Motivates the 2026 American Home Buyer
Survey data tells you what buyers say they want.
Platform data tells you what they do.
Houzeo’s 2026 home buyer report captures both: the rational layer through search filters and the emotional layer via favorites collection names. [8]
The rational layer (search filters):
- 71.5% of property-type selections go to non-single-family housing: townhouses, condos, manufactured homes, multi-family, and land. [8] Home shoppers are filtering by property type across all markets on Houzeo’s home search page.
- 70% of bedroom-specified searches target 2- or 3-bedroom homes. [8]
- 92.4% of searches include pending listings, buyers actively monitor homes under contract. [8]
The emotional layer (favorites collection names):
- The dreamers: “manifesting,” “wishful thinking,” “my forever home,” “new beginnings,” “where to next?” [8]
- The pragmatists: “move in ready,” “fixer uppers,” “Iowa Under $50,000,” “250k and under” [8]
- The life-stage signals: “my retirement home,” “nana houses,” “only husband and me in 2027” [8]
- The investors: “fix and flip,” “wholesale real estate,” “sold comps,” “prospective flip” [8]
The search filters tell you WHAT buyers want. The folder names tell you WHO they are.
And the two layers together describe a buyer who is simultaneously pragmatic (price-sorting, tracking pending inventory, filtering for fixer-uppers) and aspirational (naming folders “manifesting” and “my forever home”).
The Digital-First Buyer: 100% Online, 96% Daily Alerts
The digital transformation of home buying is no longer a transition, but a settled state:
- 100% of home buyers used the internet during their search process. [2]
- 43% said their very first step was looking for properties online, even before contacting an agent, visiting an open house, or calling a lender. [2]
- 52% ultimately purchased a home they first found on the internet. [2]
- 96% of Houzeo users opted for daily notification alerts. It’s the highest engagement tier, indicating buyers want real-time market surveillance, not weekly summaries. [8]
- Houzeo inquiry data shows 89% of inquiries come via the website and 11% via the app, with 90% originating from listings syndicated via IDX and 10% from properties listed via Houzeo’s Flat Fee MLS listing service. [8]
Yet agents remain central to the transaction: 88% of buyers still purchased through a real estate agent, according to NAR. [2]
The shift isn’t that buyers have abandoned agents; it’s that they arrive at the agent relationship with significantly more market knowledge than any prior generation.
Buyers have already narrowed their geography, property type, price range, and even tracked pending inventory before a single conversation.
The after-hours dimension:
Houzeo’s data reveals when this digital searching actually happens, and it’s not during business hours.
57% of all buyer activity on the platform occurs after 6 pm, and 29% happens between midnight and 6 am. Sunday is the busiest search day, whereas Saturday, the day built around open houses is the quietest. [8]
This contrasts with Redfin’s data showing peak traffic at 10 am on Fridays[13], likely reflecting a different buyer demographic. The divergence underscores that the “typical buyer” doesn’t have typical hours, and platforms, agents, and listing strategies optimized for 9-to-5 are missing the window when a significant buyer segment is most active. [7]
What This Means for the Industry
The composite home buyer profile of 2026 challenges assumptions at every level of the housing industry. Here’s what the new American home buyer means for:
- Agents: The new American home buyer who walks through your door has already done weeks of digital research. They’ve set daily alerts, tracked pending inventory, and compared markets across state lines. An agent’s value proposition has shifted from “I’ll find you a home” to “I’ll help you win the one you’ve already found.” The 88% agent usage rate still stands; but for execution, not discovery.
- Builders: NAR data shows buyers want 200 sq ft less than they did two decades ago. [2] Houzeo’s data shows 70% of buyers target 2–3 bedrooms and 71.5% are open to non-SFH housing. [8] The starter-home gap that NAHB has documented, “first-timers represent ~40% of new home sales but can’t find affordable product” [5] will likely be hard to close unless builders deliver smaller, more efficient units at affordable price points.
- Real Estate Portals: The after-hours search pattern (57% after 6pm, 29% midnight–6am) has operational implications. Listing alert timing, customer support availability, and ad scheduling should follow the buyer’s clock, not an agent’s. The 96% daily alert adoption on Houzeo suggests buyers treat real-time market surveillance as a baseline expectation, not a premium feature. [8]
- Policymakers: A market where the median first-time buyer is 40, first-timers represent 21% of transactions, and 56% of a major platform’s offers are all-cash is a market that is concentrating housing wealth rather than distributing it. Every year the first-time share declines, the wealth gap between owners and renters compounds.
The buyer has changed.
The question is whether the industry changes with them.
This article is part of Houzeo’s 2026 housing research series. For the complete data study, see the 2026 Home Buyer Report.
Methodology
This article combines nationally recognized housing industry datasets with proprietary buyer behavior data from Houzeo to understand who is purchasing homes in America in 2026 and how buyer behavior is changing.
Houzeo Buyer Behavior Data
This analysis was conducted by Jai Chavan, Digital Marketing Manager at Houzeo, using anonymized platform data from January through September 2026. Jai Chavan researches housing market trends, consumer behavior, and digital real estate using proprietary Houzeo platform data and public housing datasets.
The dataset includes:
- 5,201 buyer inquiries
- 881 saved searches
- 656 favorites collections
- 501 submitted offers
- More than 900 unique buyer users
The analysis examined:
- search behavior
- property preferences
- geographic demand
- saved search patterns
- inquiry behavior
- offer financing type
- digital engagement patterns
Data Processing
All buyer activity was aggregated and analyzed at a population level. No personally identifiable information was used. Data is anonymized and aggregated in accordance with Houzeo’s Privacy Policy.
Buyer names, addresses, and account information were excluded from analysis. Favorites collection names were analyzed only as aggregated behavioral signals to understand buyer intent patterns.
Limitations
This report combines national housing datasets with proprietary platform data. While these sources provide valuable insight into buyer behavior, several limitations should be considered. Houzeo findings should not be interpreted as a nationally representative sample of all American home buyers.
Search Behavior vs Completed Purchases
Houzeo search filters, saved searches, and favorites reflect buyer interest and intent. They do not necessarily represent completed transactions.
For example:
- a saved property does not guarantee a purchase
- a selected filter does not guarantee a final home choice
- a viewed market does not guarantee relocation
Geographic Distribution
Houzeo activity varies by state depending on:
- MLS availability
- inventory levels
- brand awareness
- platform adoption
Higher activity levels indicate platform engagement and buyer interest, not necessarily total market demand.
Time Period
Houzeo platform analysis covers January–September 2026. Housing conditions, mortgage rates, inventory, and buyer behavior may change over time.
External Sources
2. National Association of Realtors, “2025 Profile of Home Buyers and Sellers,” November 2025
3. Freddie Mac, “Primary Mortgage Market Survey (PMMS),” September 17, 2026
6. National Association of Realtors, “2025 Profile of International Transactions in U.S. Residential Real Estate” / Migration Research & International Transactions in U.S. Residential Real Estate
7. Redfin, “Migration Trends and Where Homebuyers Are Moving in 2026,” June 2026
8. Houzeo, “2026 Home Buyer Report,” September 2026
9. Mortgage Reports, “Mortgage Rate History | Chart & Trends Over Time 2026,” March 23, 2026
10. Realtor.com, “Down Payments Fall in 2026 as Housing Market Sags,” May 19, 2026
12. Fannie Mae, “97% Loan to Value Options”
About Houzeo Research
Houzeo Research analyzes proprietary real estate platform data alongside public housing, demographic, and economic datasets to identify emerging trends in how Americans search for, buy, sell, and value homes. By combining real-time consumer behavior with housing-market data, Houzeo Research aims to provide a closer look at the decisions and patterns shaping the U.S. housing market.
Our research uses anonymized and aggregated platform data. Individual users are never identified, and findings are presented with methodology and limitations to distinguish observed behavior from broader national trends.
Reports By Houzeo:
The 2026 Home Buyer Report: What 1,500+ Houzeo Buyer Actions Reveal