 New Construction
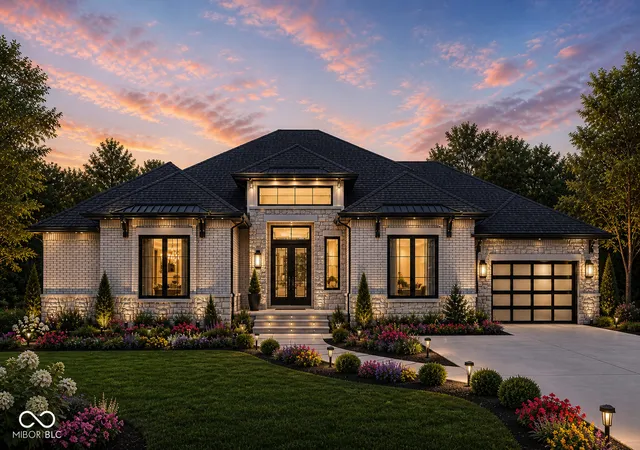

$1,350,000
Views: 6

Bedrooms: 5Bds
Bathrooms: 5Ba
Area: 6,188sqft
Mansion for sale
MLS ID #22101895, Century 21 Scheetz


Do Real Estate on the Go!
New Construction$1,350,000
Views: 6
Bedrooms: 5Bds
Bathrooms: 5Ba
Area: 6,188sqft
Mansion for sale
MLS ID #22101895, Century 21 Scheetz
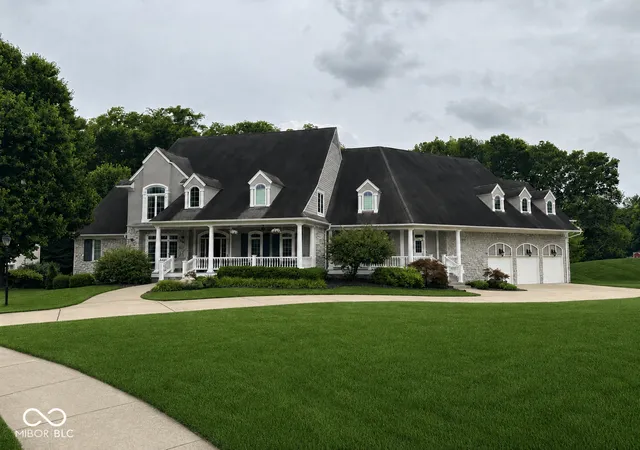
$2,100,000
Views: 15
Bedrooms: 5Bds
Bathrooms: 7Ba
Area: 12,006sqft
Mansion for sale
MLS ID #22116732, Carpenter, Realtors®
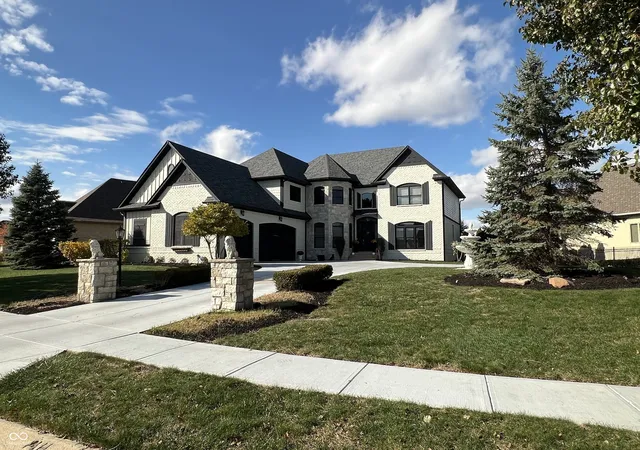
$1,295,000
Views: 10
Bedrooms: 6Bds
Bathrooms: 6Ba
Area: 5,945sqft
Mansion for sale
MLS ID #22070948, My Agent
 3D Tour
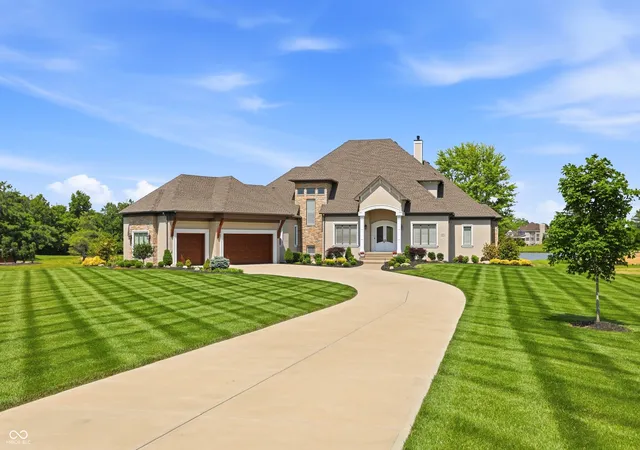
$2,150,000
Views: 6
Bedrooms: 5Bds
Bathrooms: 6Ba
Area: 7,250sqft
Mansion for sale
MLS ID #22102328, Century 21 Scheetz
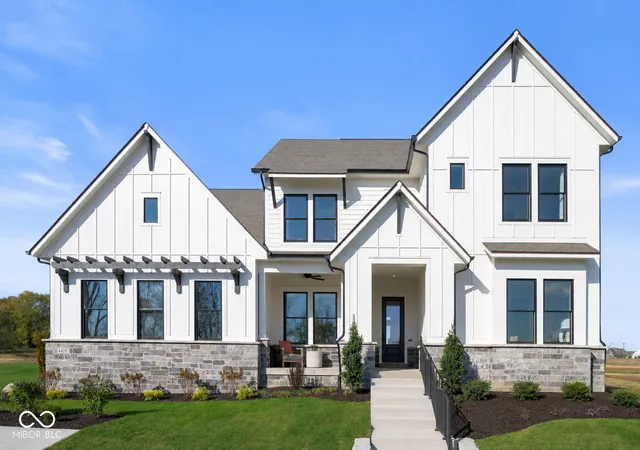
$1,599,990
Views: 4
Bedrooms: 6Bds
Bathrooms: 5Ba
Area: 5,400sqft
Sale Pending
MLS ID #22117622, Weekley Homes Realty Company
3D Tour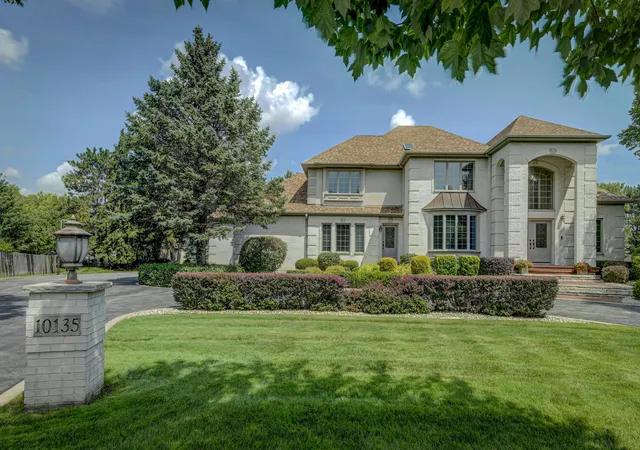

$1,549,999
Views: 2
Bedrooms: 7Bds
Bathrooms: 7Ba
Area: 7,698sqft
Mansion for sale
Re/Max Realty Associates, Kris Hoge. Listing provided by NIRA
3D Tour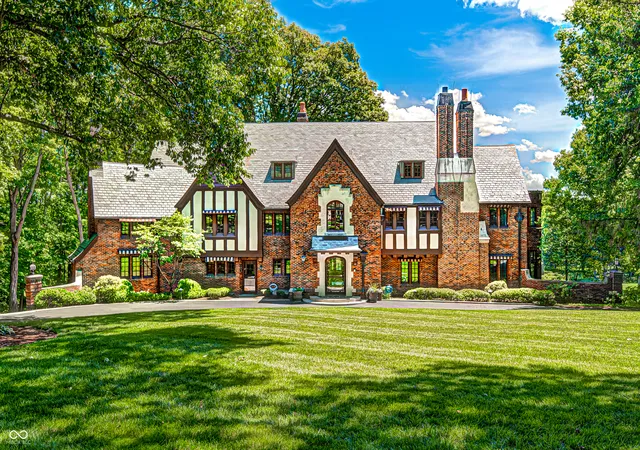
$7,995,000
Views: 16
Bedrooms: 6Bds
Bathrooms: 8Ba
Area: 8,714sqft
Mansion for sale
MLS ID #22103395, Century 21 Scheetz
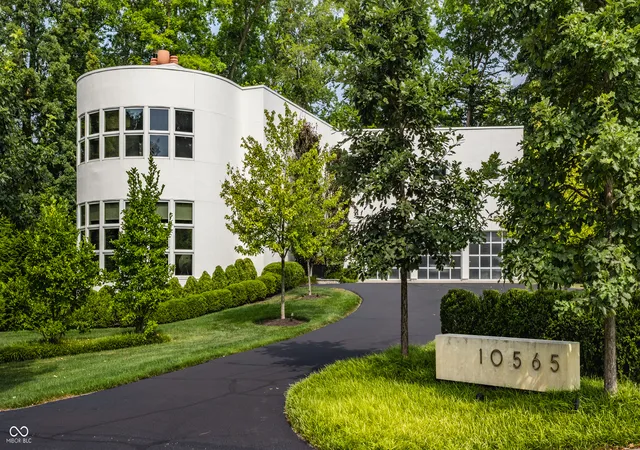
$4,250,000
Views: 6
Bedrooms: 5Bds
Bathrooms: 6Ba
Area: 6,658sqft
Mansion for sale
MLS ID #22110259, F.C. Tucker Company
New Construction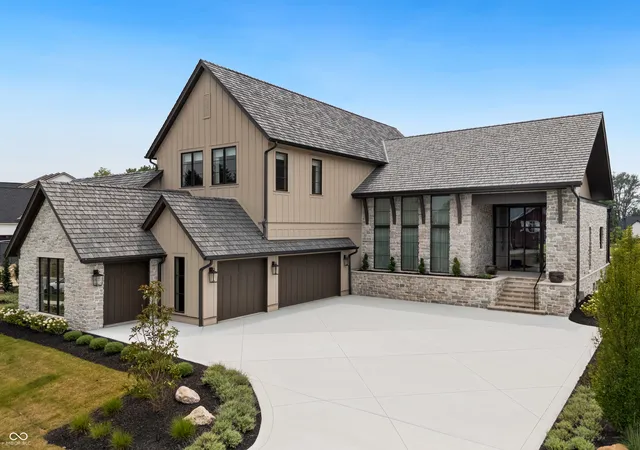
$4,450,000
Views: 6
Bedrooms: 5Bds
Bathrooms: 6Ba
Area: 6,542sqft
Mansion for sale
MLS ID #22119273, Lazzara Real Estate
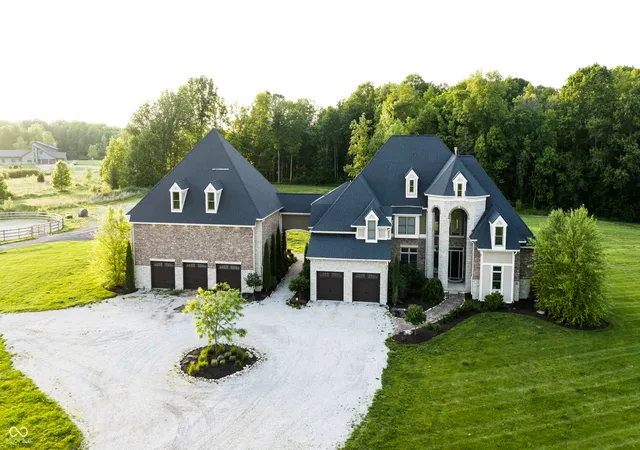
$3,750,000
Views: 10
Bedrooms: 6Bds
Bathrooms: 7Ba
Area: 8,549sqft
Mansion for sale
MLS ID #22114242, Whitetail Properties
3D Tour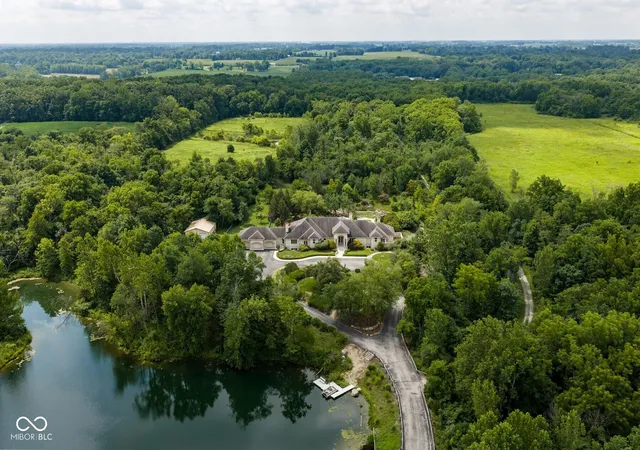
$5,450,000
Views: 6
Bedrooms: 5Bds
Bathrooms: 8Ba
Area: 11,890sqft
Mansion for sale
MLS ID #22088074, Encore Sotheby'S International
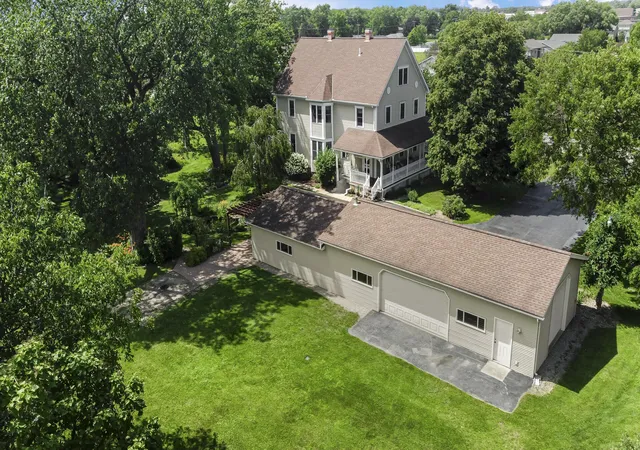
$1,120,000
Views: 13
Bedrooms: 8Bds
Bathrooms: 4Ba
Area: 5,568sqft
Mansion for sale
Rock Realty Group Llc, Jessica Yack. Listing provided by NIRA
New Construction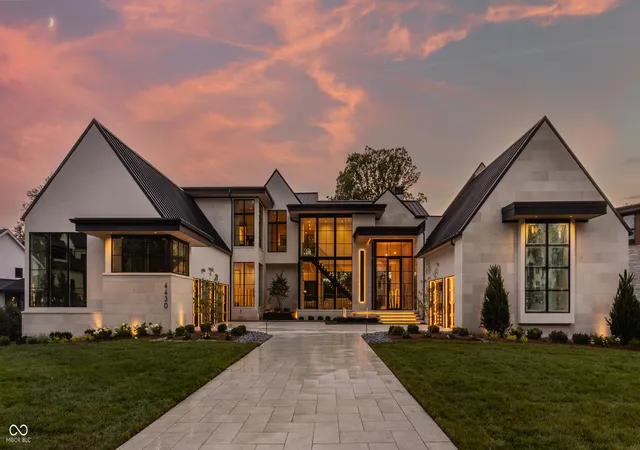
$10,975,000
Views: 11
Bedrooms: 5Bds
Bathrooms: 10Ba
Area: 11,398sqft
Mansion for sale
MLS ID #22103488, The Agency Indy

$2,495,000
Views: 5
Bedrooms: 6Bds
Bathrooms: 6Ba
Area: 8,010sqft
Sale Pending
MLS ID #22085675, Re/Max Realty Services
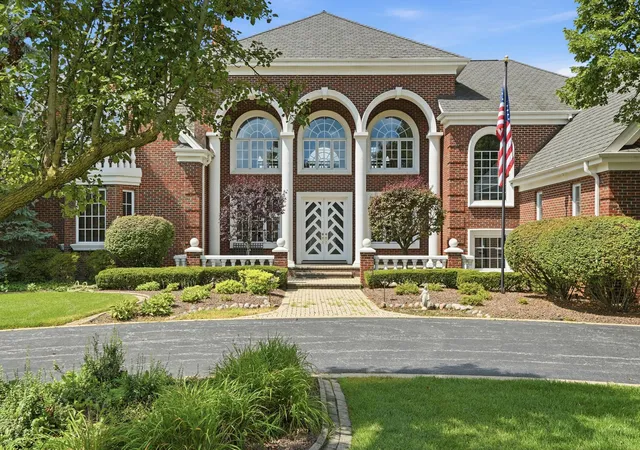
$1,999,900
Views: 10
Bedrooms: 5Bds
Bathrooms: 6Ba
Area: 8,835sqft
Mansion for sale
Mccolly Real Estate, Aziza Gil. Listing provided by NIRA
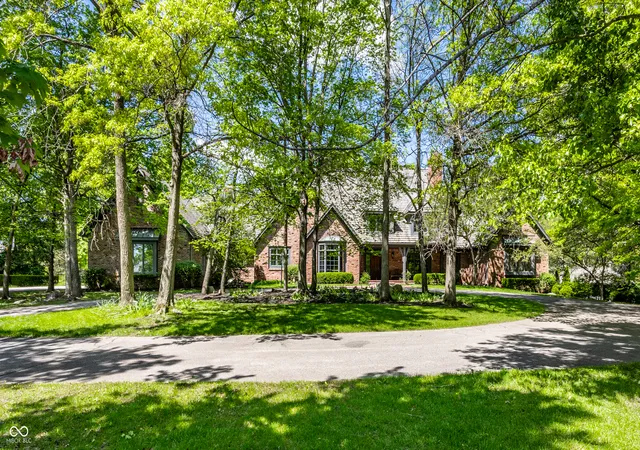
$3,495,000
Views: 8
Bedrooms: 5Bds
Bathrooms: 8Ba
Area: 11,102sqft
Mansion for sale
MLS ID #22099083, F.C. Tucker Company
3D Tour
$1,899,900
Views: 13
Bedrooms: 7Bds
Bathrooms: 4Ba
Area: 5,332sqft
Mansion for sale
Mccolly Real Estate, Lisa Grady. Listing provided by NIRA
3D Tour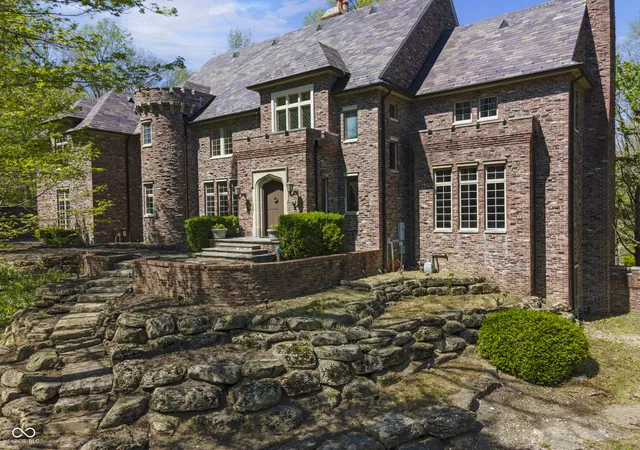
$1,590,000
Views: 15
Bedrooms: 5Bds
Bathrooms: 6Ba
Area: 10,264sqft
Mansion for sale
MLS ID #22096480, Indy'S Performance Team Realty
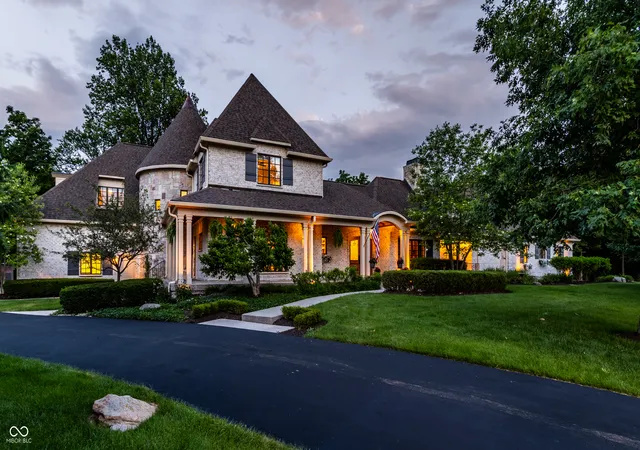
$2,295,000
Views: 7
Bedrooms: 5Bds
Bathrooms: 6Ba
Area: 9,951sqft
Mansion for sale
MLS ID #22102964, The Agency Indy
3D Tour

$1,050,000
Views: 8
Bedrooms: 5Bds
Bathrooms: 4Ba
Area: 4,378sqft
Mansion for sale
Vogel Real Estate
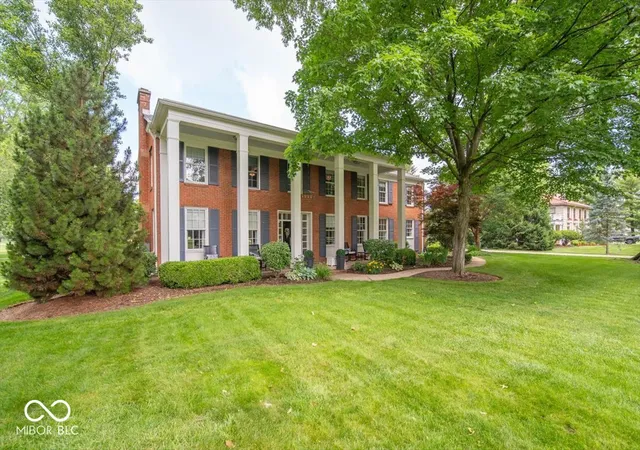
$1,200,000
Views: 5
Bedrooms: 6Bds
Bathrooms: 5Ba
Area: 5,947sqft
Mansion for sale
MLS ID #22107193, Richardson Realty Company, Llc
 No HOA


$1,749,900
Views: 5
Bedrooms: 5Bds
Bathrooms: 3Ba
Area: 5,298sqft
Sale Pending
Coldwell Banker Realty
3D TourNo HOA
$1,688,800
Views: 11
Bedrooms: 6Bds
Bathrooms: 5Ba
Area: 8,593sqft
Sale Pending
Sibcy Cline, Inc.
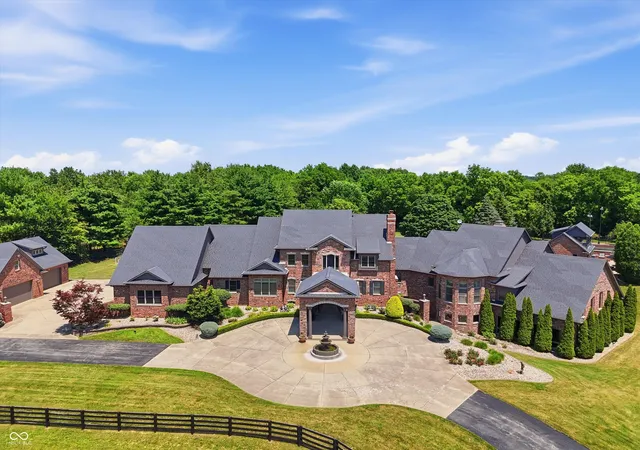
$5,750,000
Views: 6
Bedrooms: 6Bds
Bathrooms: 10Ba
Area: 14,404sqft
Mansion for sale
MLS ID #22112490, F.C. Tucker Company
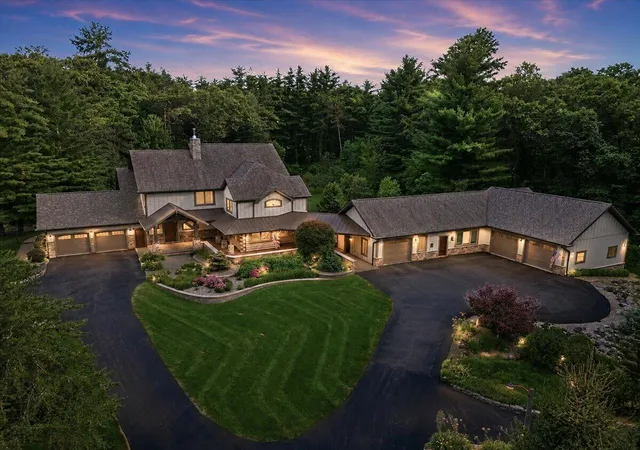
$3,299,999
Views: 16
Bedrooms: 5Bds
Bathrooms: 7Ba
Area: 7,492sqft
Mansion for sale
Seramur Properties, Llc, Alisha Fowler. Listing provided by NIRA
3D Tour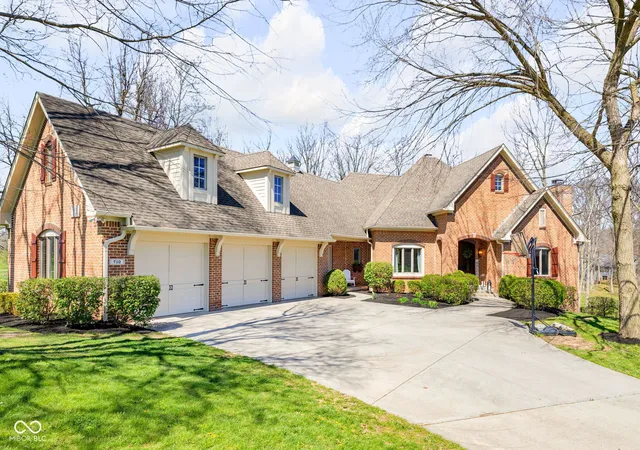
$1,139,000
Views: 5
Bedrooms: 5Bds
Bathrooms: 6Ba
Area: 7,306sqft
Sale Pending
MLS ID #22089725, @Properties
3D Tour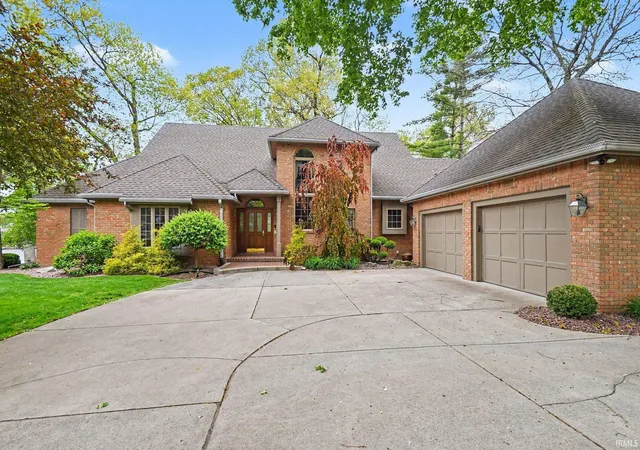
$1,049,990
Views: 8
Bedrooms: 5Bds
Bathrooms: 5Ba
Area: 6,193sqft
Mansion for sale
Snyder Strategy Realty Inc.
New Construction
$2,249,000
Views: 5
Bedrooms: 6Bds
Bathrooms: 6Ba
Area: 6,668sqft
Sale Pending
MLS ID #22099276, The Agency Indy
3D Tour
$1,200,000
Views: 6
Bedrooms: 5Bds
Bathrooms: 5Ba
Area: 6,584sqft
Mansion for sale
Bhhs Executive Realty, Mirko Bebekoski. Listing provided by NIRA
3D Tour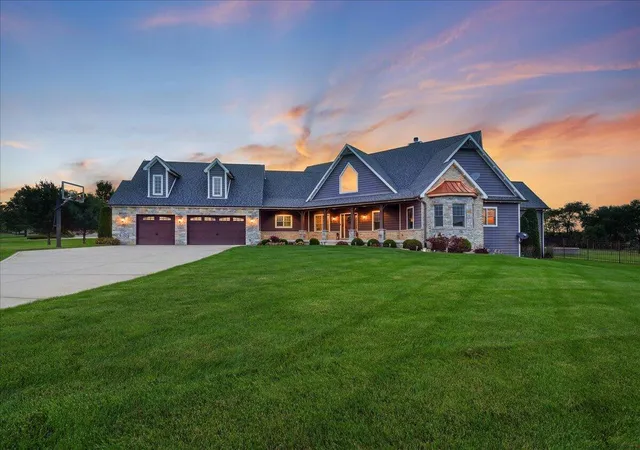
$1,200,000
Views: 15
Bedrooms: 5Bds
Bathrooms: 5Ba
Area: 5,440sqft
Mansion for sale
Mccolly Real Estate, Lisa Grady. Listing provided by NIRA
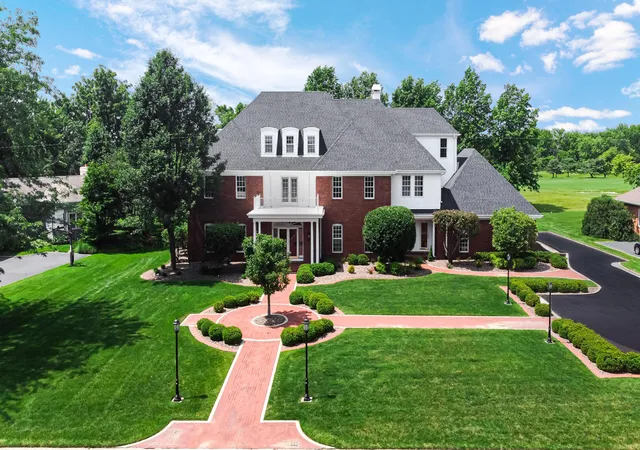
$1,999,000
Views: 8
Bedrooms: 5Bds
Bathrooms: 7Ba
Area: 10,383sqft
Mansion for sale
Mccolly Real Estate, Tom Boyle. Listing provided by NIRA
3D Tour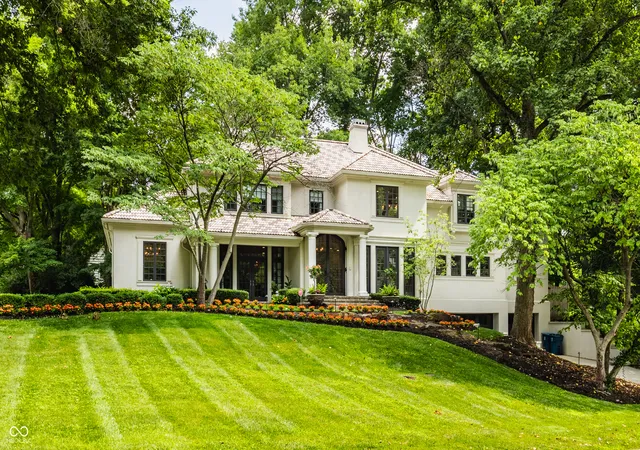
$1,974,900
Views: 8
Bedrooms: 5Bds
Bathrooms: 7Ba
Area: 8,748sqft
Mansion for sale
MLS ID #22095942, F.C. Tucker Company
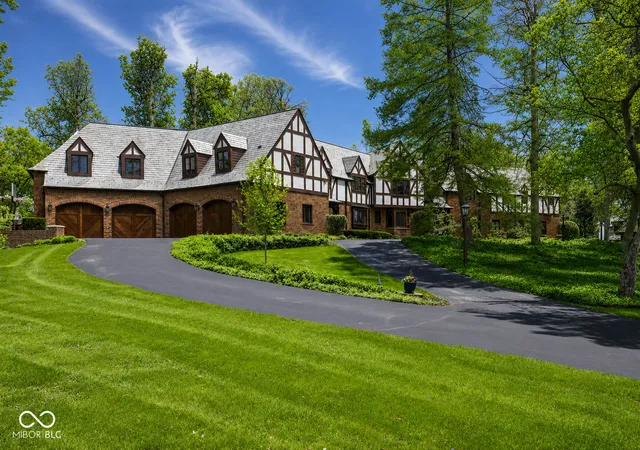
$5,000,000
Views: 2
Bedrooms: 5Bds
Bathrooms: 8Ba
Area: 10,548sqft
Mansion for sale
MLS ID #22098208, F.C. Tucker Company

$4,900,000
Views: 5
Bedrooms: 6Bds
Bathrooms: 9Ba
Area: 17,582sqft
Mansion for sale
MLS ID #22103328, Lohmiller Real Estate
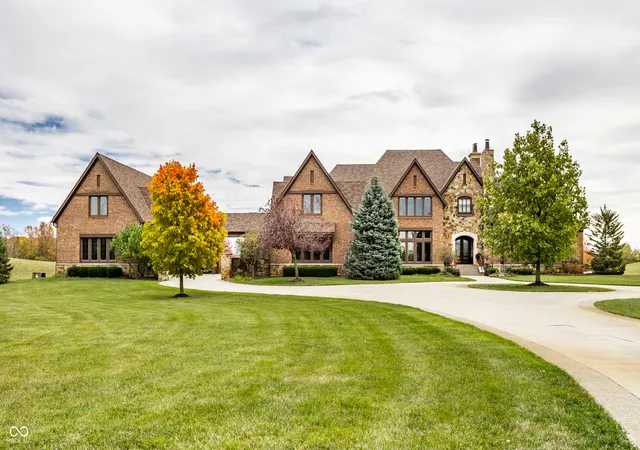
$3,995,000
Views: 4
Bedrooms: 6Bds
Bathrooms: 7Ba
Area: 16,584sqft
Mansion for sale
MLS ID #22102985, Encore Sotheby'S International
New Construction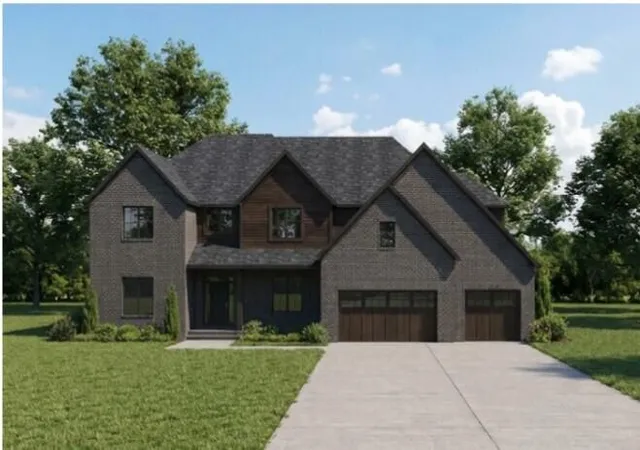
$1,500,000
Views: 11
Bedrooms: 7Bds
Bathrooms: 8Ba
Area: 8,207sqft
Sale Pending
Mccolly Real Estate, Dawn Veness. Listing provided by NIRA

$5,995,000
Views: 10
Bedrooms: 6Bds
Bathrooms: 10Ba
Area: 22,177sqft
Mansion for sale
MLS ID #22102946, Encore Sotheby'S International
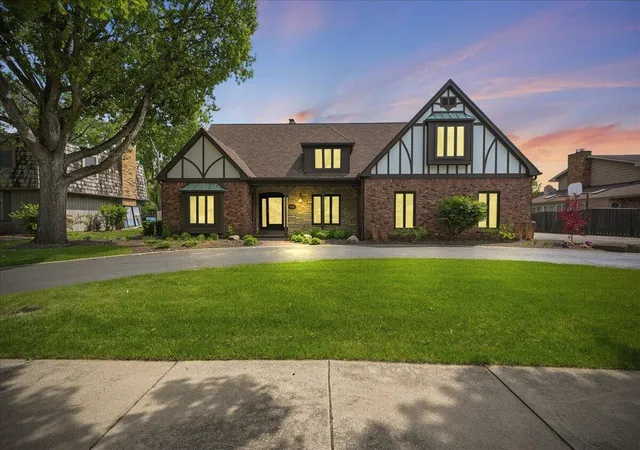
$1,595,000
Views: 9
Bedrooms: 5Bds
Bathrooms: 6Ba
Area: 6,409sqft
Mansion for sale
Keller Williams Preferred Real, Matthew Maloney. Listing provided by NIRA
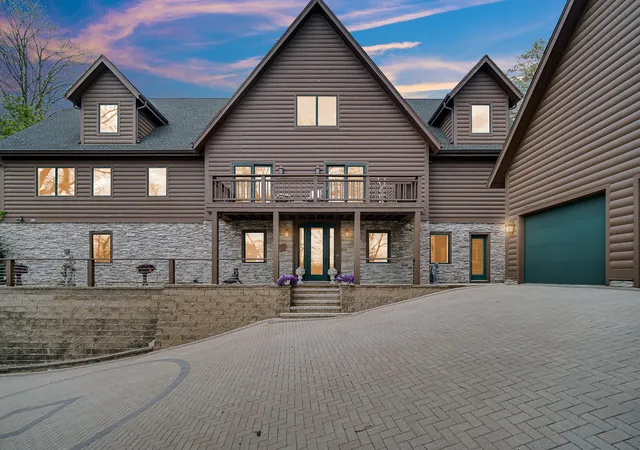
$2,795,000
Views: 5
Bedrooms: 5Bds
Bathrooms: 5Ba
Area: 8,792sqft
Mansion for sale
@Properties/Christie'S Intl Re, Theodore Lelek. Listing provided by NIRA
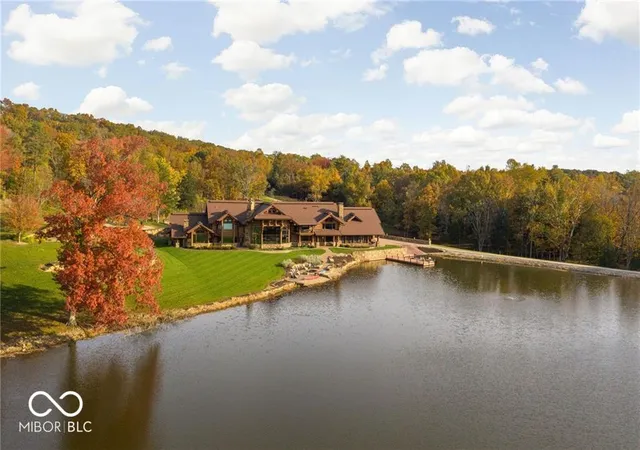
$18,900,000
Views: 3
Bedrooms: 6Bds
Bathrooms: 11Ba
Area: 18,658sqft
Mansion for sale
MLS ID #22100819, Compass Indiana, Llc

$3,850,000
Views: 8
Bedrooms: 5Bds
Bathrooms: 7Ba
Area: 9,550sqft
Sale Pending
MLS ID #22099507, F.C. Tucker Company
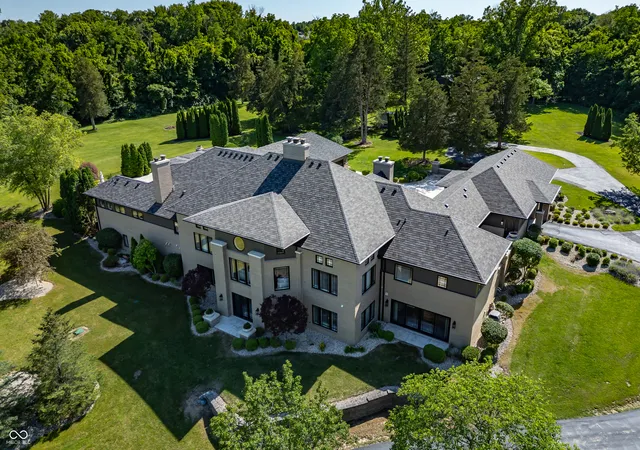
$3,499,999
Views: 5
Bedrooms: 5Bds
Bathrooms: 7Ba
Area: 14,095sqft
Mansion for sale
MLS ID #22093599, F.C. Tucker Company
Showing 169 - 210 of 217 homes for sale in Indiana
Don't miss out on new listings — and get instant email alerts!
Do Real Estate on the Go!
Find your dream home, receive real-time updates, and many more!
Indiana is a balanced market, giving buyers and sellers room to negotiate. With 3 months of supply and homes averaging 63 days on the market, you can make decisions without the pressure of a highly competitive market.
Balanced Market
63
12,186
In Sep 2026 · YoY
Current rate · YoY
30-Year Fixed
30-yr fixed rate 6.23% · Data as of Sep 2026 · Source: Houzeo Research.
View Full Indiana Market Report


217
Homes Available

$ 300,000
Median List Price

63 Days
Avg on Market
